
Batch Score - Quality Assurance
As previously described, the BeerBotz system records the temperature and CO2 during a batch. To
create the "Batch Score" after a fermentation has been completed, the Excel™ spreadsheet is queried for
two values:
- Gas start time (when first noticeable gas comes out) aka: lag time
- Time to peak CO2 gas flow rate
These two values can be determined unambiguously from the batch spreadsheet data. The values for each batch
contribute to building a "Batch Score" graph. All of the previous batches are represented on this
graph. This allows you to see your average batch performance and, most importantly, spot a batch that
has performed below average. A poor performer probably had problems with the yeast that was used. The
Batch Score can be used to monitor the quality of your yeast!
Adding a yeast pitch to the unfermented wort sugars is a little like throwing a match on a pile of
gun powder. Once the reaction starts it creates a bunch of gas. The difference is that, with beer
fermentations, the speed of the reaction can be tempered/slowed by lowering the wort temperature.
For all fermentations, there is a beginning (first noticeable gas) and a peak gas flow. Since the entire
reaction is slowed by making the wort colder the expectation is that, on average, these values would
change with the temperature that the wort is kept at.
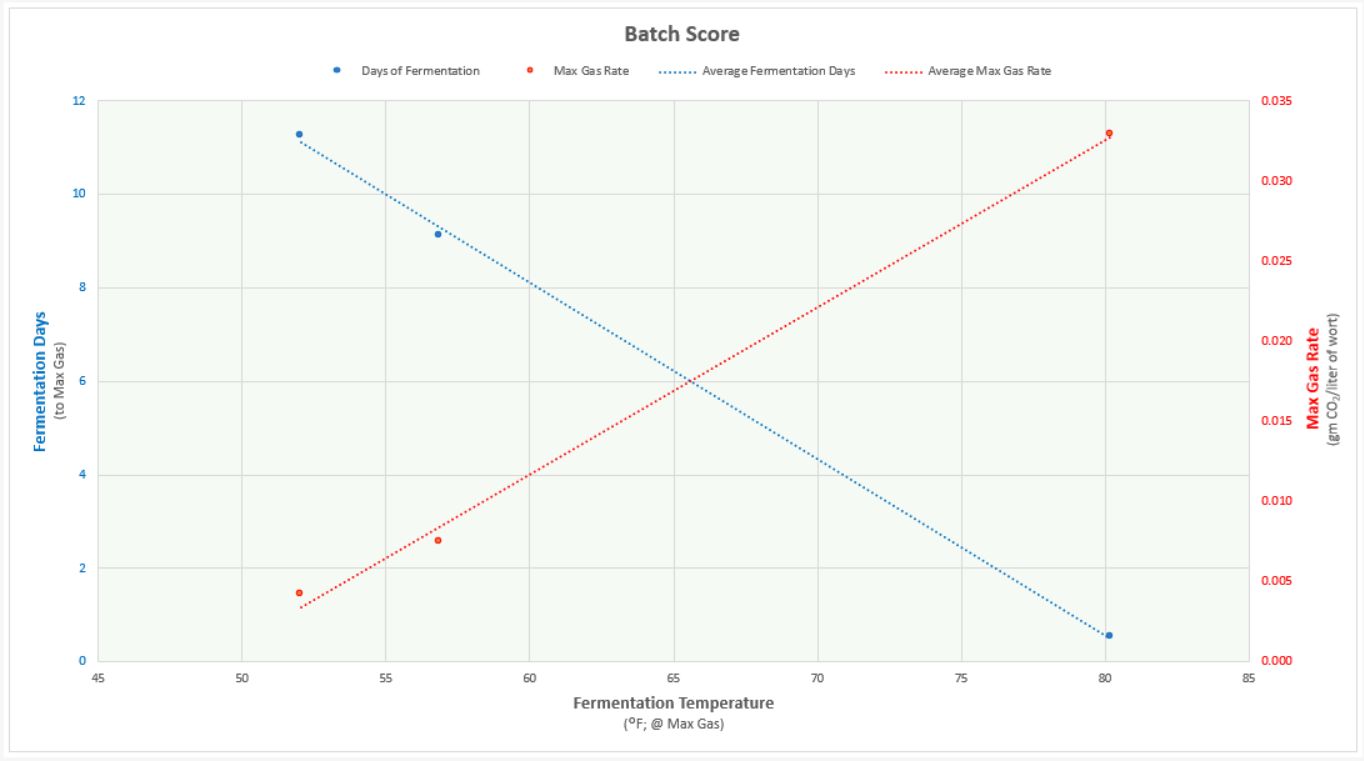
In the Batch Score graph above, the temperature is the main x axis. This is because the expectations for
the performance rates of the batch depends primarily on temperature. The blue/left y axis is the
fermentation time (gets longer for colder wort). The red/right y axis is the actual observed peak gas
measurement (higher/more gas for warmer wort).
Each batch shows an entry for fermentation time and peak gas rate (the dots). The lines are linear
trendlines that are automatically generated by Excel™ from the batch data. These lines are the average
expectation for the performance of a batch in your operation at the given temperature. Since these
trendlines are automatically generated they will get more precise as more data points/batches
are added. Let's look further at where a batch reading (dot) can appear on the graph and what that
means.
 Fermentation Days
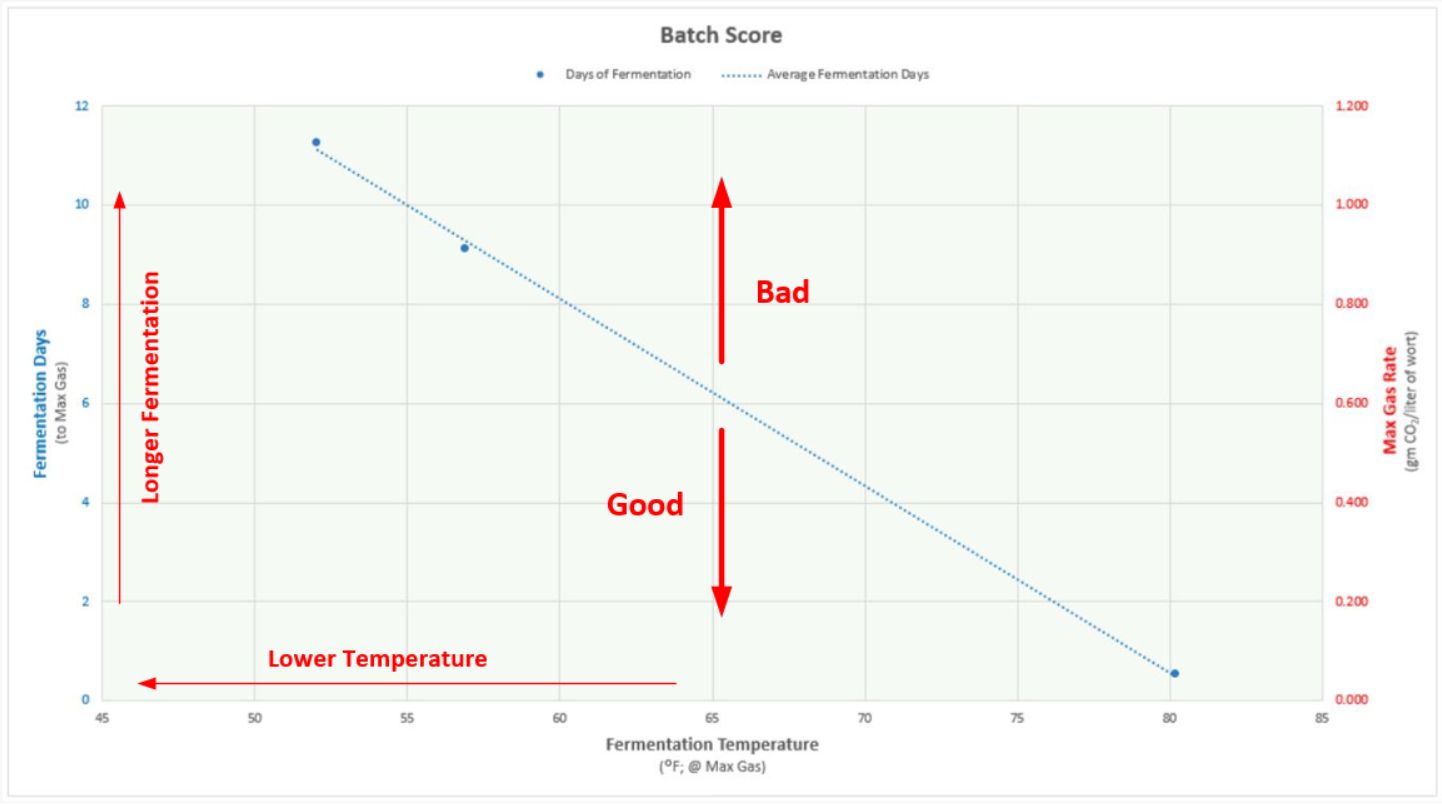
Fermentation Days (length of fermentation) is on the left y axis. The higher the value, the longer the
fermentation took. Notice that, from the average line, the lower the temperature (x axis), the longer
the expected fermentation time.
Now, say you have just placed the data in the Batch Score graph, and you see the data point is higher than
the average line. That means that your last batch has taken longer than normal for a given batch...
which is bad. There was a problem with the yeast pitch.
If the data point appears below the average line (or on the line), it just indicates normal operations
(all is well!).
 Maximum Gas Rate
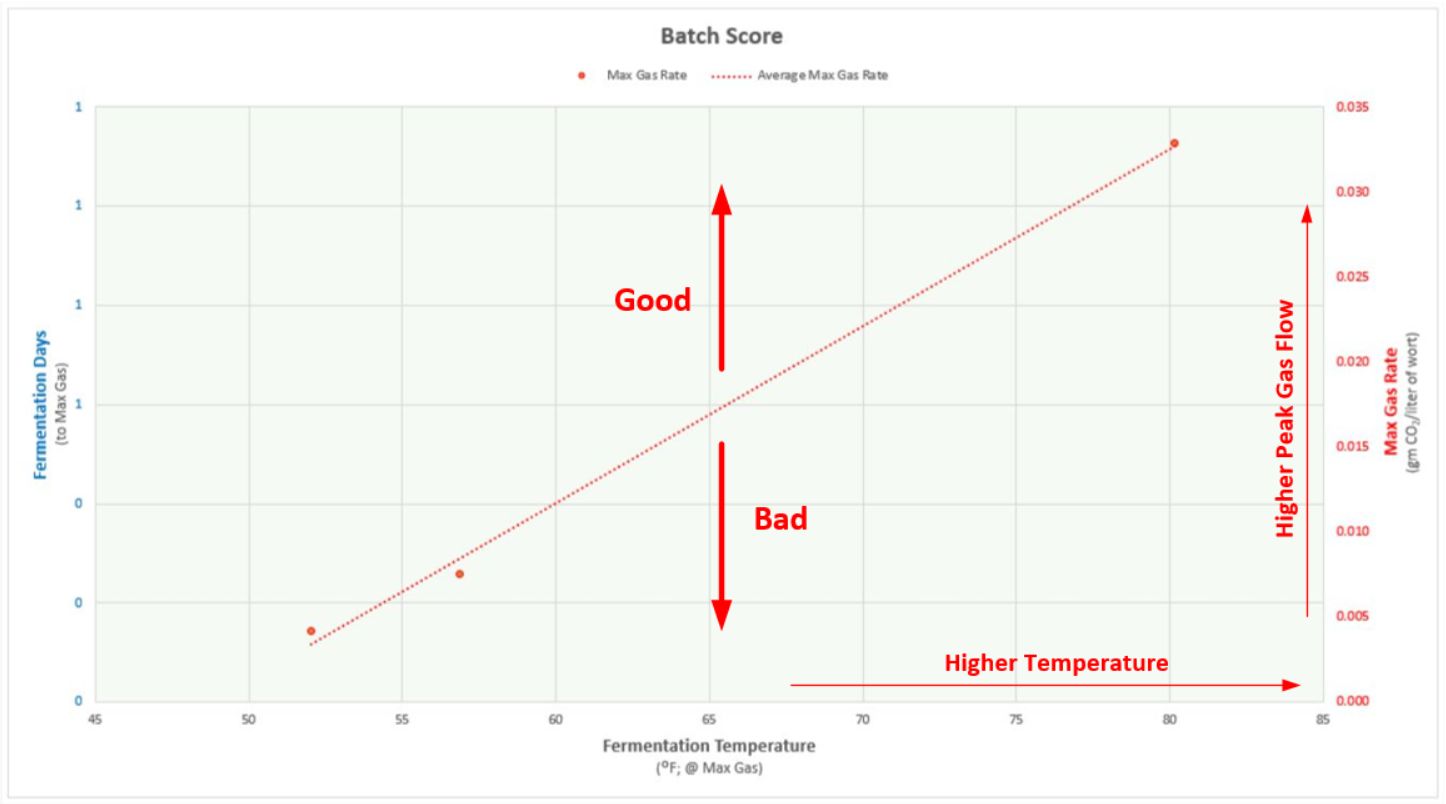
Maximum Gas Rate (peak CO2 flow) is on the right y axis. The higher the value, the greater
amount of gas was produced from an individual meter reading. This is the "explosive force" for this
batch (to continue the gun powder analogy). From the average line you can see that, as the
temperature increases, the expected peak gas flow increases (bigger boom!).
Now, say you have just placed the data in the Batch Score graph, and you see the data point is higher than
the average line (or on the line). That means that your last batch had a peak gas flow rate higher than/or
equal to the expected rate for a given batch. No problems here... move along!
If the data point appears below the average line then the peak gas flow was lower than normal. There was a problem
with the vigor of the yeast... they did not "push" with the expected force.
That is the Batch Score graph! It allows you to compare the performance of all of your previous batches in
one view. It helps you to accumulate your organizational knowledge and identify potential process
improvements. Next, take a look at how these two values (Gas Start & Max Gas) are acquired from the
raw batch data spreadsheets: Batch Score Instructions.