
BeerBotz - Software Overview
There is a need for monitoring and documenting the temperatures and exhausted carbon dioxide (CO2)
during the beer brewing fermentation process. The qualities of these fermentation variables have a
profound impact on the quality and flavor of the final product. These observations are also useful
with maintaining the health of the yeast, as it is usually re-used in commercial applications. Finally,
having documentation of previous batches can assist with repeatability, consistency, and process
improvements.
The BeerBotz Fermentation Monitoring system is a USB-based hardware/software solution that can
provide measurements of temperature and CO2 and store them in a Microsoft Excel™ spreadsheet. A
chart based off of these values (in the same Workbook) can be continually updated as the values
are added. The BeerBotz device has connected temperature probes and gas meters that are installed
on the fermenters. These values are all that are needed for the BeerBotz system to calculate the current
specific gravity of the batches. The BeerBotz application (on a Windows™ PC) receives packets of updated
information (via USB cable) from the BeerBotz device, and displays/stores it. The BeerBotz application
is also assigned its’ own email address, which it can check once a minute. If an email with a specific
subject line is received, the BeerBotz application will create a full graph from the Excel™ data, and
reply to the sender with the latest chart. In this way, anyone anywhere with email access can get an
update of the current fermentation conditions.
Additionally, there are two companion applications: the BeerBotz Viewer, and the Android Widget/app.
The BeerBotz Viewer (a Windows™ application) is used to query the BeerBotz application (via email)
at user-defined time intervals, and display the resulting graph in either a window or a full screen
format. This allows any remote monitor/TV to display the updated brewing data. The Android Widget
places an Icon on an Android phone desktop which, when pressed, requests and displays a graph from
the BeerBotz device.
The remainder of this document will outline further details about the system. We will first see what
the data looks like from a fermentation. Next we will do a quick run-through on setting up the
BeerBotz system to monitor and save the input data (temperature and CO2) and respond to
update request emails. We then will see how to use the BeerBotz Viewer to display the updated chart
on a remote monitor/TV. Finally, we will look at the installation and use of the BeerBotz
Android™ Widget. In addition to this document, there are detailed videos that explain each
of these topics here: Training Videos
Fermentation Graphs
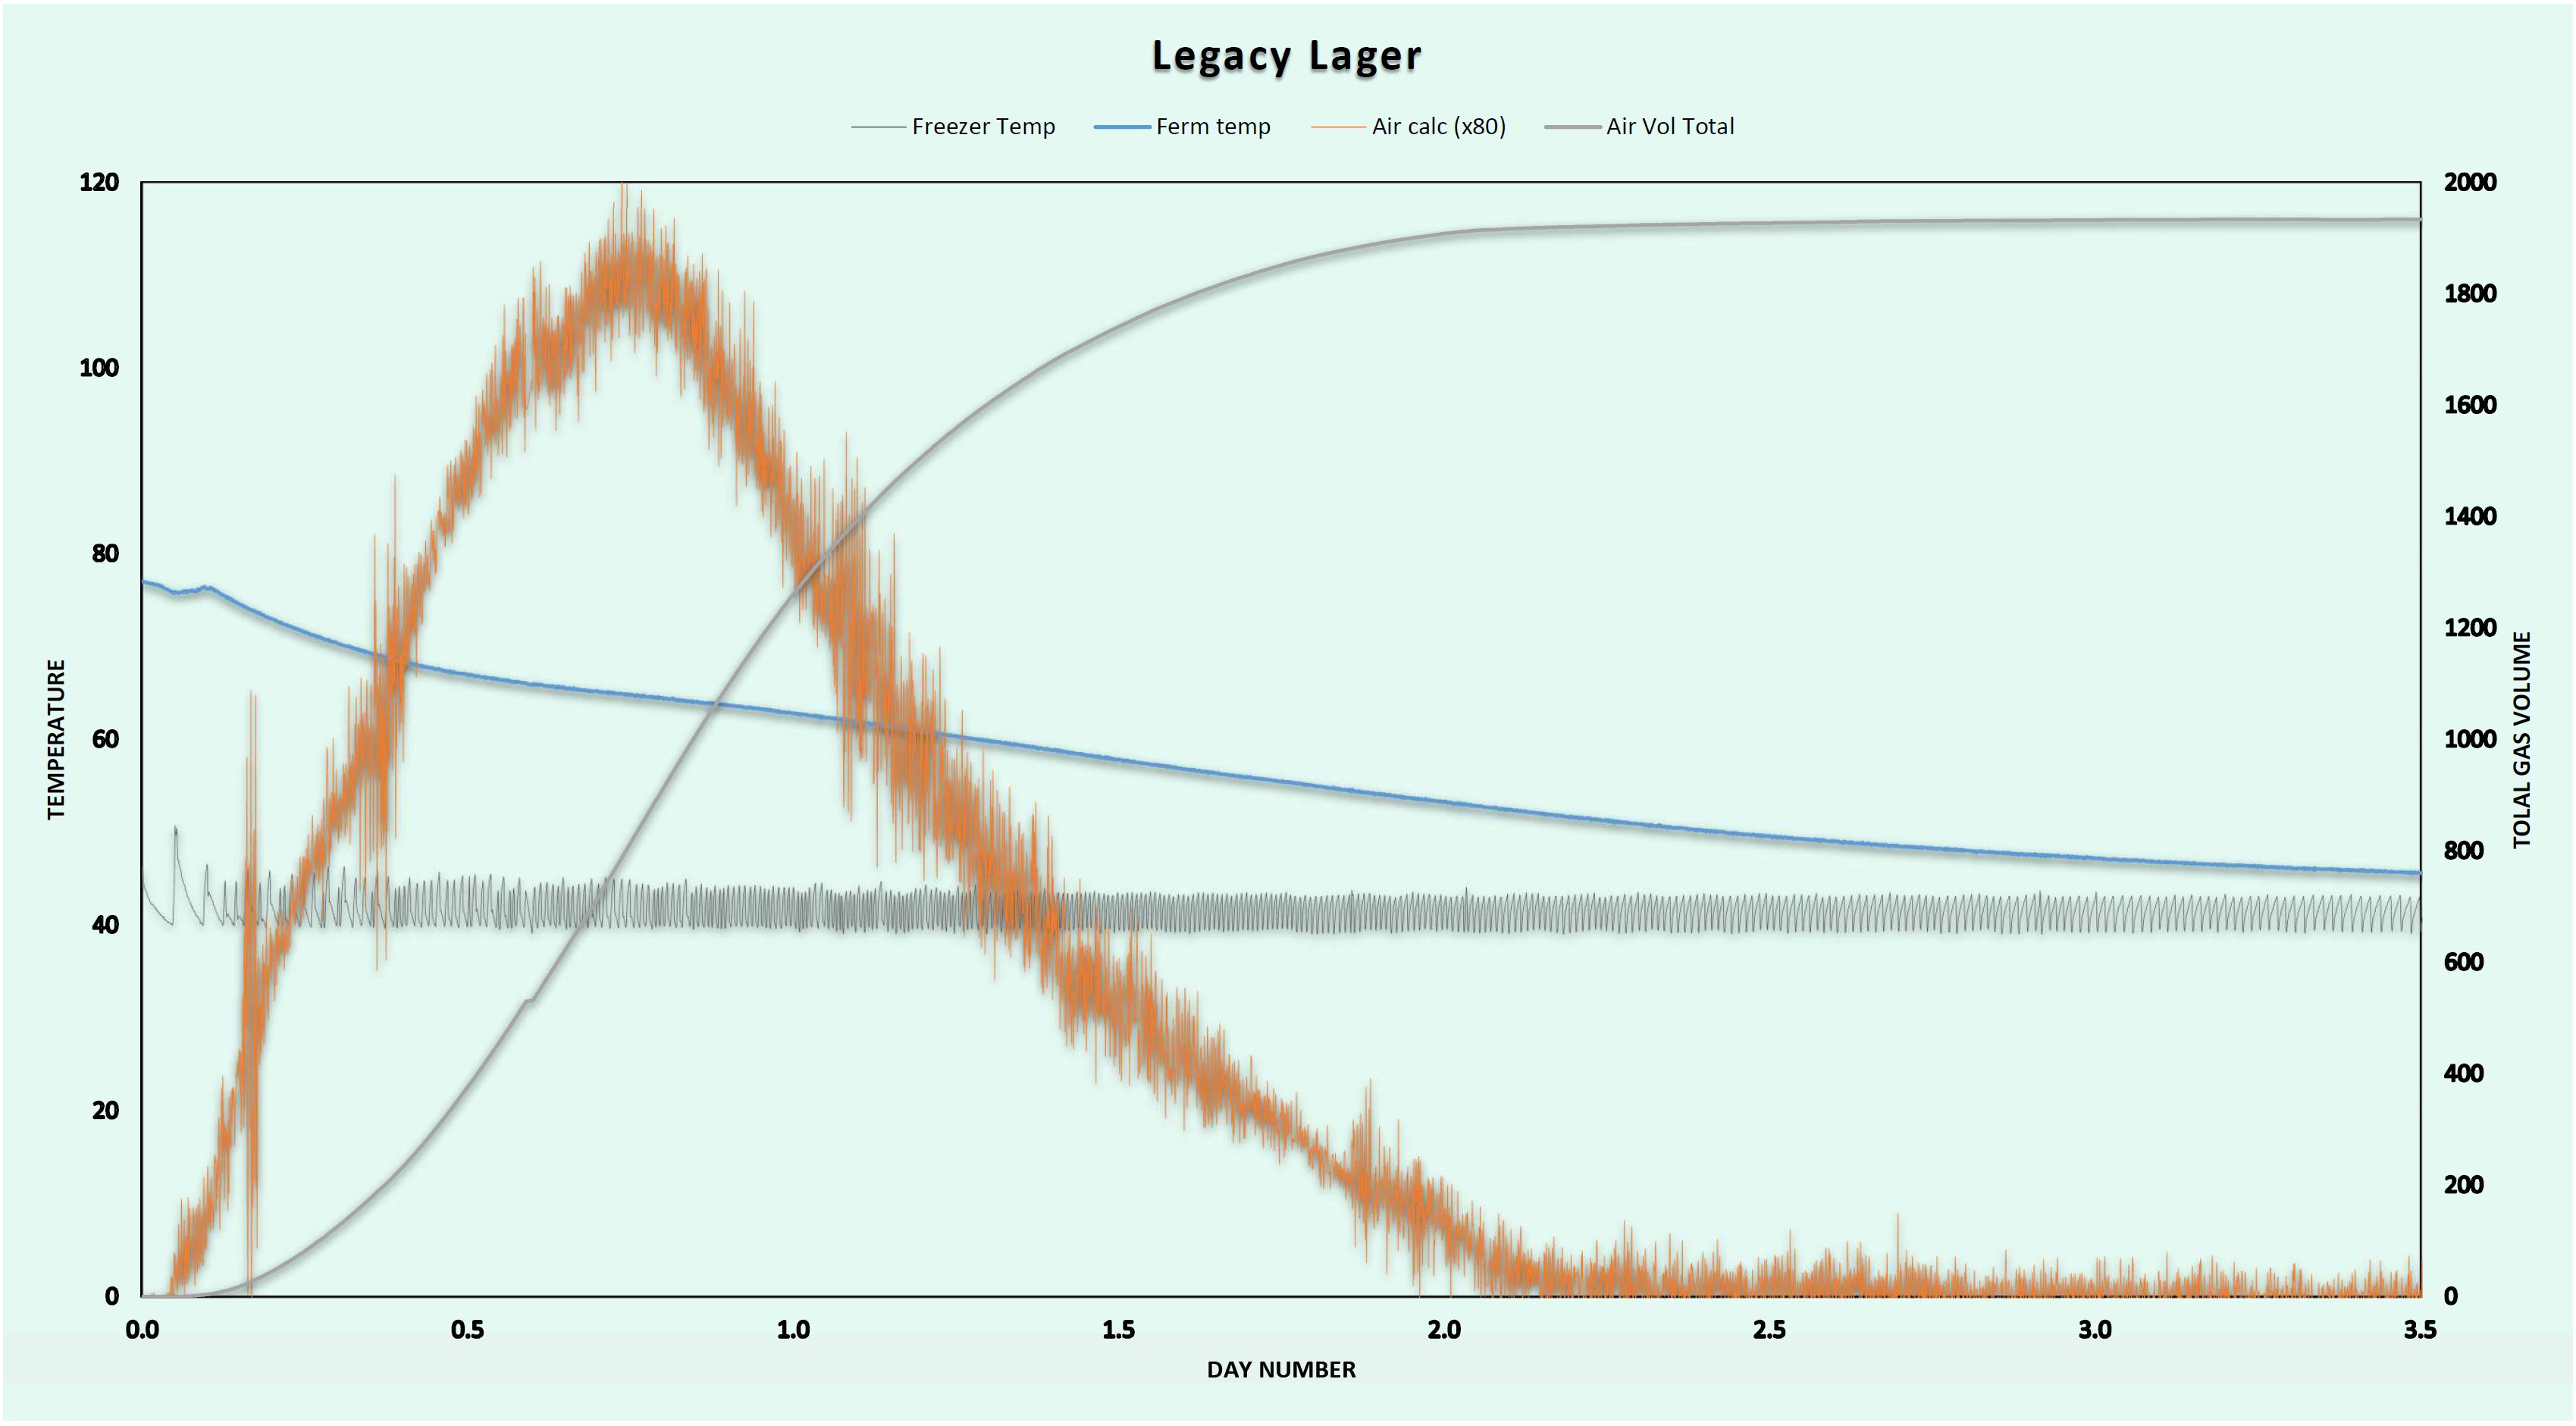
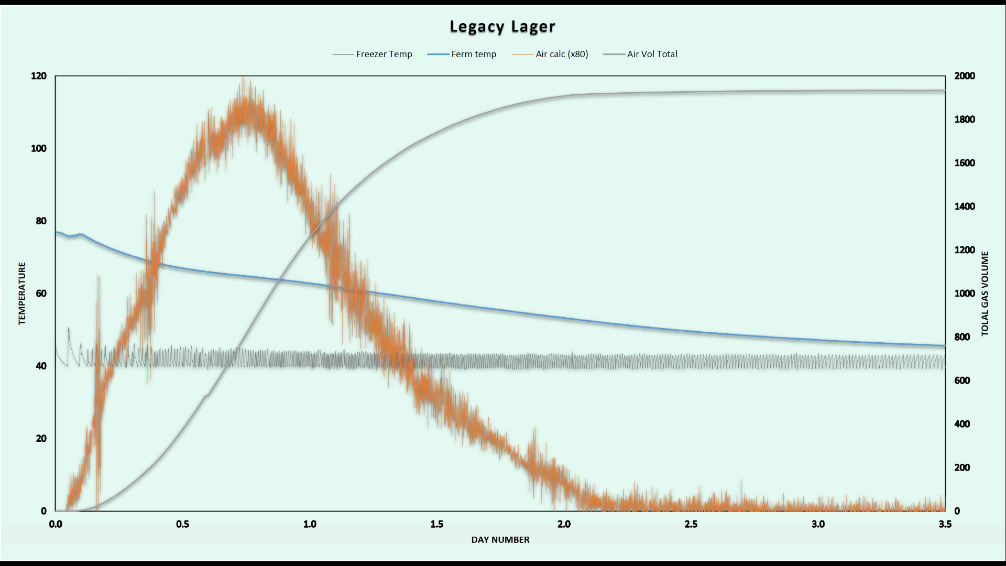
The following graph demonstrates what the temperature and CO2 data looks like from a complete
fermentation. The blue line that starts at 80 (in degrees Fahrenheit) is the temperature inside the
fermenter. This was a 25 gallon fermenter inside a freezer. The BeerBotz device controls the temperature of
the freezer by cycling its power on and off with a relay. You can see this temperature cycling inside
the freezer displayed as the black line.
The orange line is the rate of CO2 gas (volume) coming off of the fermenter. It starts as
nothing (when the yeast is first pitched), increases as the yeast exponentially grow (and make ethanol),
and finally stops once the malt sugars have been consumed. The S-shaped black line is a totalized view
of the gas produced. This data series is calculated by adding up all of the gas volumes from the orange
line. This line starts at zero (no gas volume) then rises and flat-lines at some total gas volume. This
total gas volume is related to the beginning amount of fermentable sugars that were present inside the
fermenter. It is also related to the final amount of ethanol that has been produced during this
fermentation.
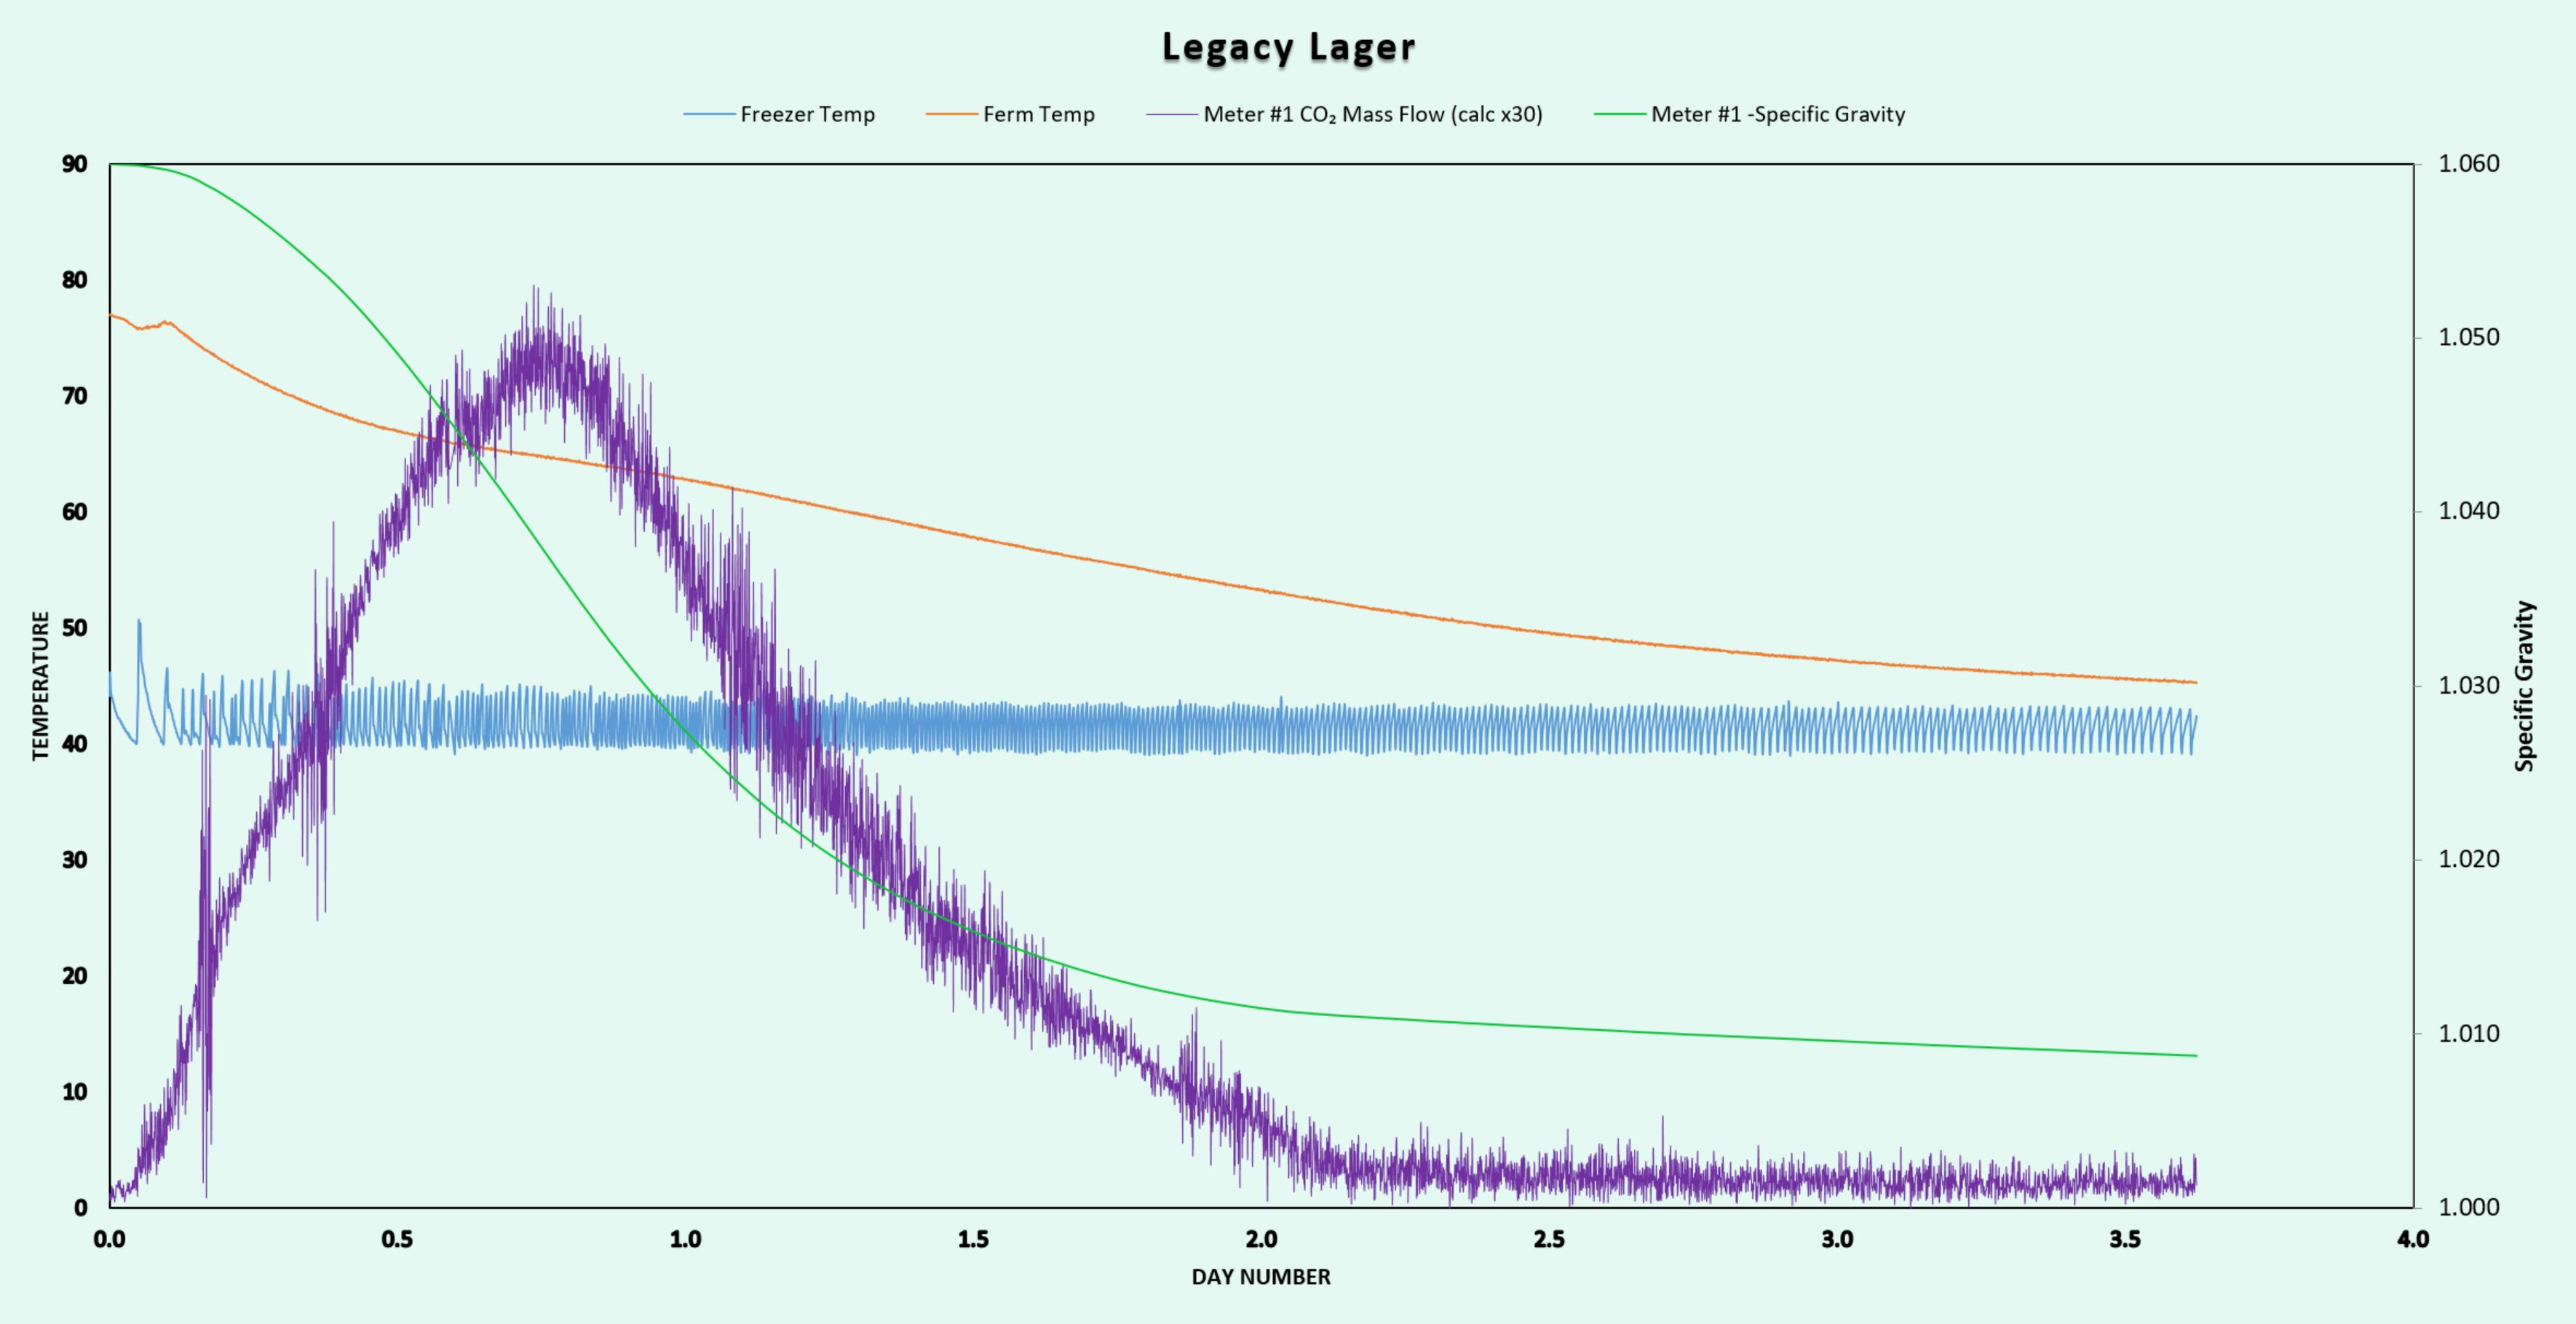
With the benefit of US Patent 6,942,962 we can use the mass volume of the CO2 gas to
calculate sugars consumed (specific gravity) during the fermentation. The relationship between the starting
sugars/CO2/ethanol/yeast mass are related to each other as defined in the Patent. At the beginning of the
fermentation the starting specific gravity and wort volume is measured and recorded. As the fermentation
transpires, the BeerBotz system can create a running calculation displays the current specific gravity
as it decreases.
BeerBotz Device
The BeerBotz hardware has 5 temperature probe inputs (Type-J thermocouples) and three gas meter inputs.
(An example gas meter is the Honeywell AWM5000 series.) It also has an on-board barometer (for correcting
the gas meter results if necessary) and two relay outputs. The relays can switch <7 amps of 120 Volt
power to control the internal temperature of a medium-sized chest freezer by cycling the freezer compressor
motor on and off.
The temperature probes need to be installed to be in contact with the fermenting liquid (usually via a
thermowell mounted on the fermenter sidewall). The Honeywell gas meters are damaged if they ever get
liquid in them, so they must be installed after a sparger/water trap on the gas outlet of the fermenter.
For the remaining discussion, we will assume that these sensors are properly installed (See relevant
installation videos).
BeerBotz – Application Setup
 Main Page
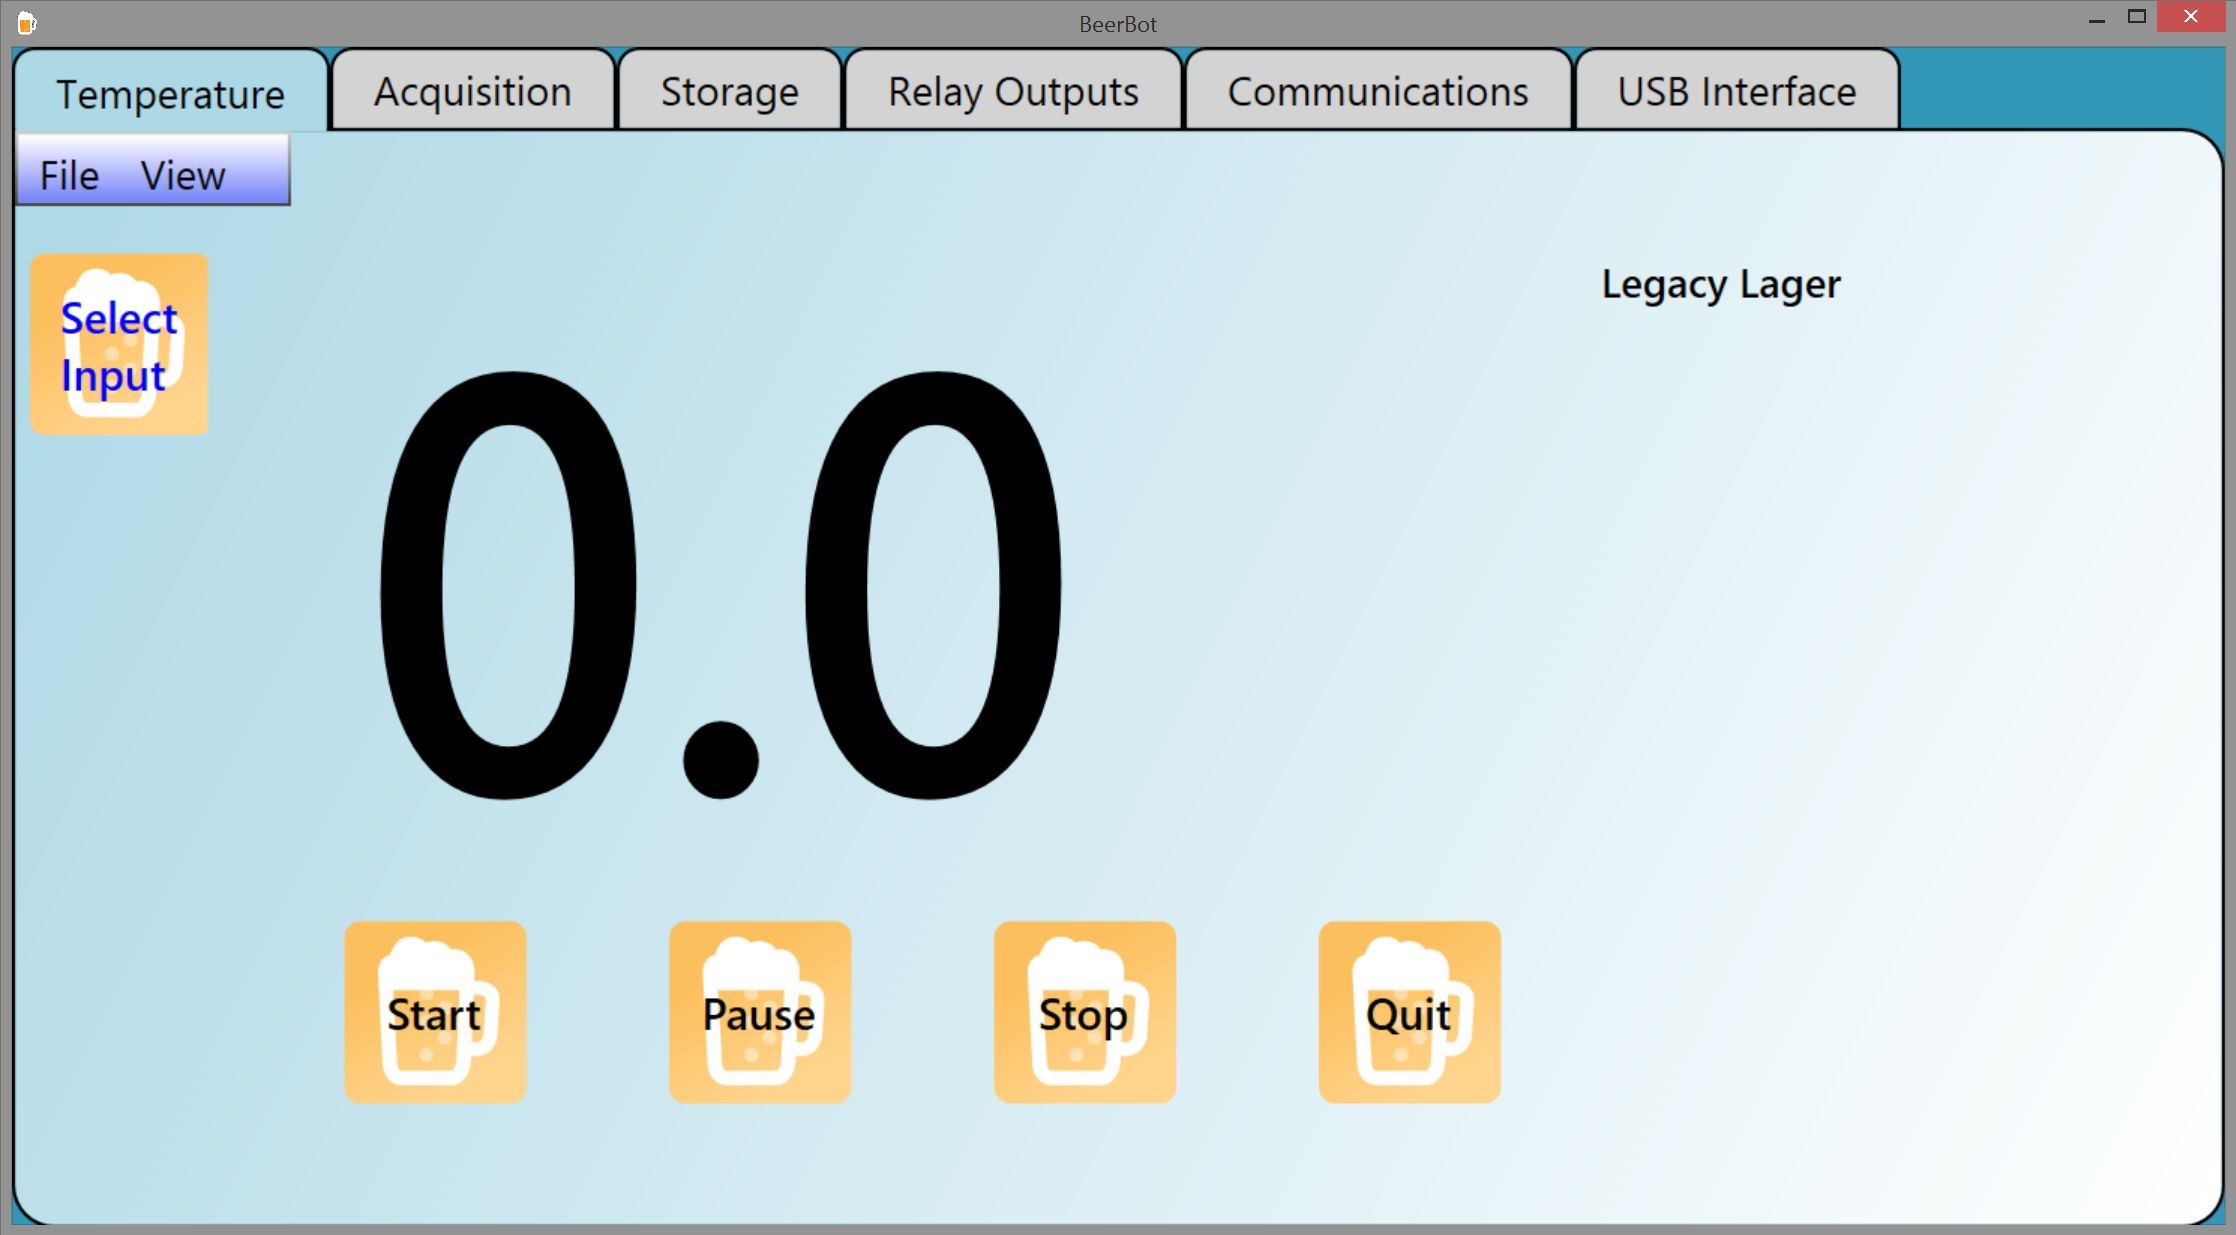
The application opens up to the Main page. This is where the input sampling is started and stopped. All
of the settings for a particular batch can be saved out as a file name. This file name appears in the
top right corner (“Legacy Lager”). This name will also appear as the title on the Excel™ chart. The
“0.0” is the current reading for the selected input value. This value can be toggled to display as a
full screen either by double-clicking it or selecting the View menu item.
 Acquisition Page
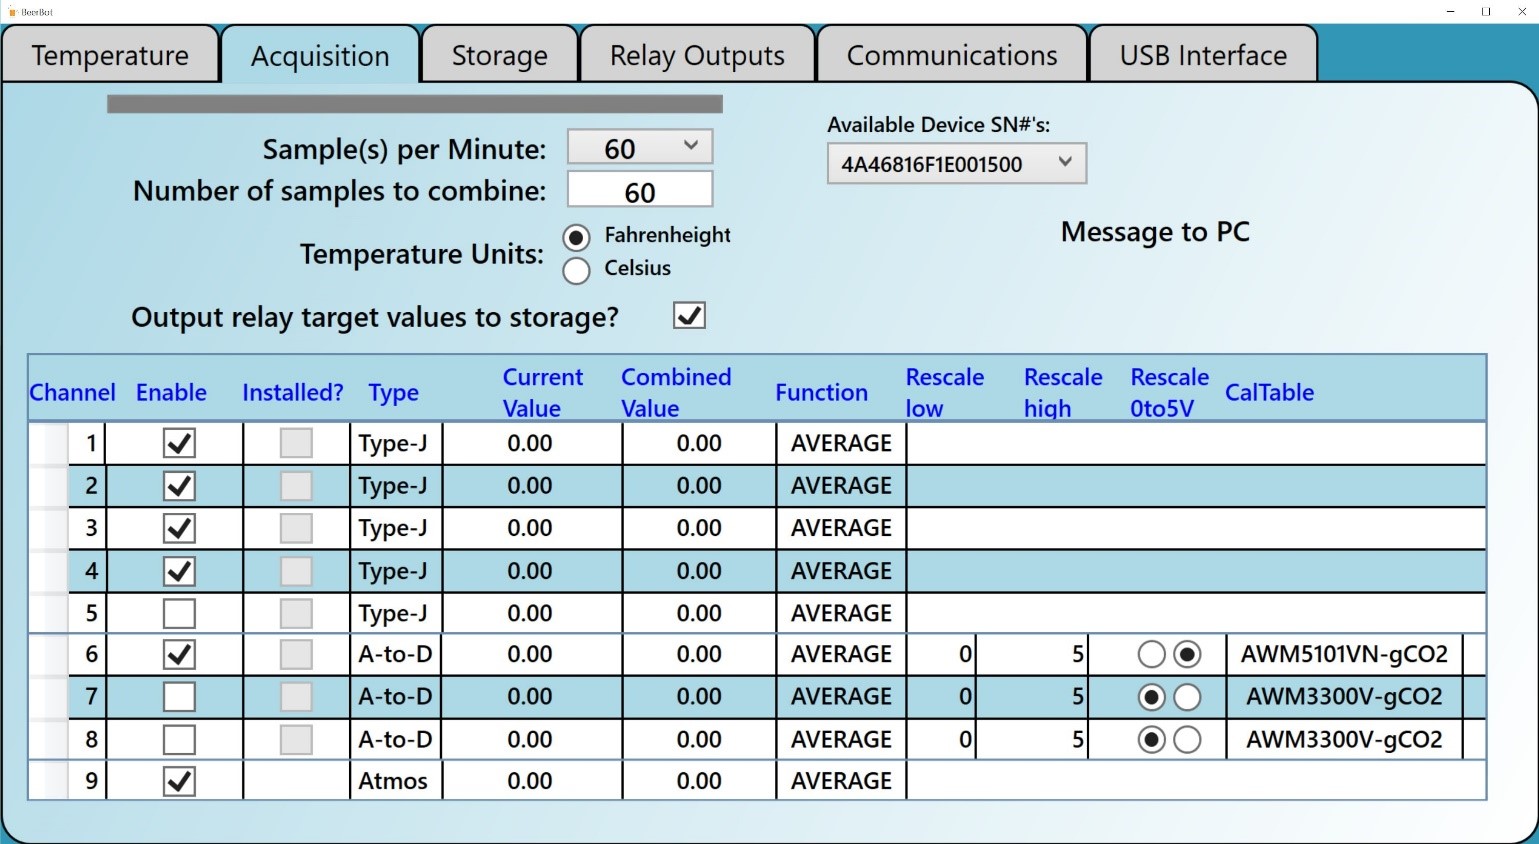
The Acquisition Page is where the sensor inputs are enabled. Samples per Minute sets the update interval
from the hardware. Samples to Combine sets the number of these update packets to be combined into one
Excel™ row. These are combined using the statistical function specified in the “Function” column for
each individual input (normally set as "AVERAGE"). The BeerBotz app uses the built-in statistical
functions available in Excel™... that is where this drop-down selection list comes from.
In addition to enabling/configuring the desired inputs here, the particular BeerBotz hardware device
is also selected (via Available Device SN#’s). Once a device is “Started” (on the Main Page), that
devices’ serial number will not be available to a second BeerBot app instance. In other words the
BeerBotz app has an exclusive relationship with its selected hardware device.
 Storage Page
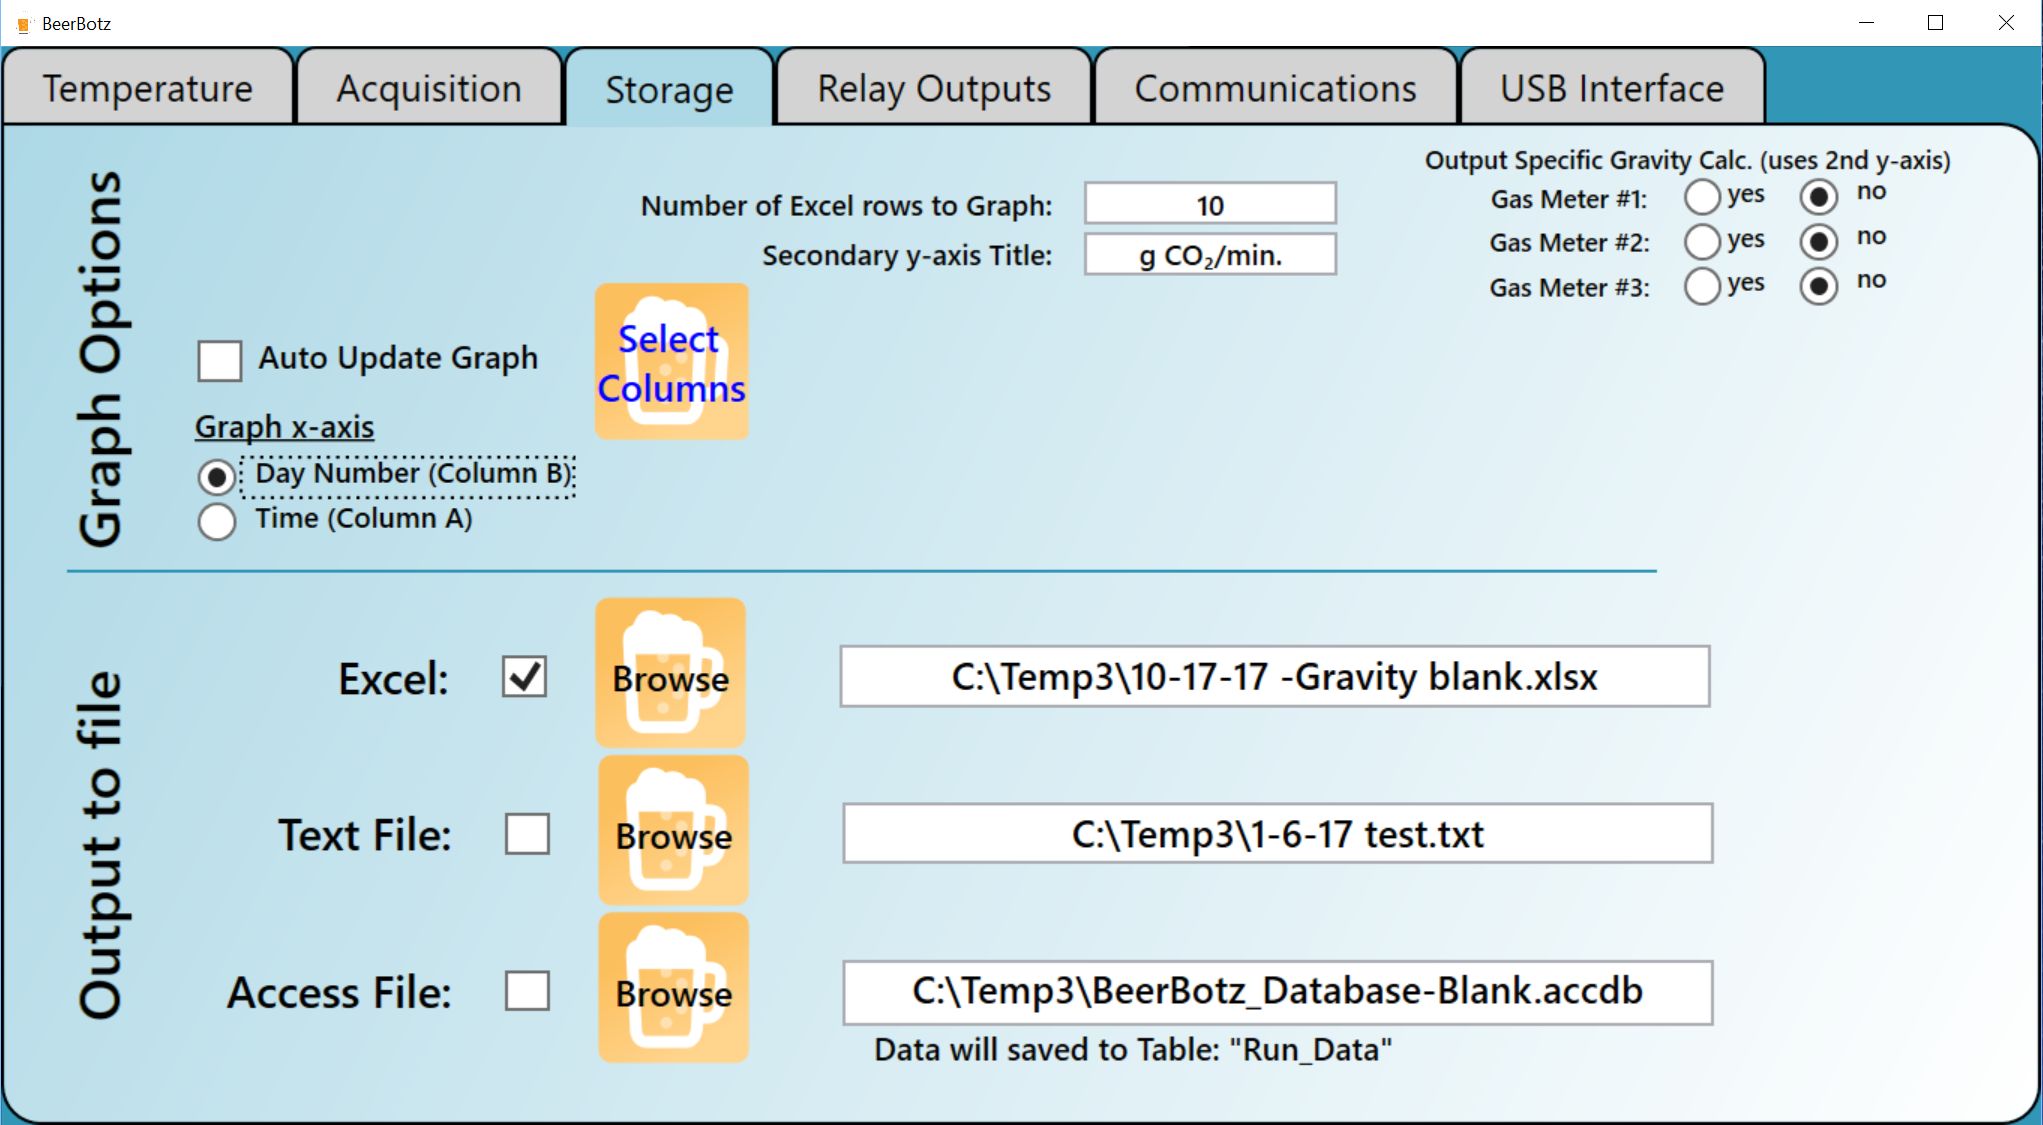
The third and final page that needs to be visited in order to get the inputs working is the Storage
Page. This is where we specify where and how the data we collected (as defined in the Acquisition
Page) gets stored. Most importantly, one must specify the valid Excel™ workbook location that will
be used for the app to do its statistical calculations. If the Excel: checkbox is checked, that
means that the data will actually populate (and graph the data) in this workbook as well. We can
also choose to save the data in a Text File, and/or an Access™ database. There are specific Excel™
and Access™ blank files that must be used for these selections (they are in a specific format). For
the text file, a brand new (csv file type) file is created every time.
The remaining settings have the following functionality:
Auto Update Graph.
If checked, the source data for the chart (on sheet two of the
defined Excel™ workbook) will be updated every time a new row is added. When a chart email
request is received the app pauses and creates a full chart regardless of this setting.
This checkbox should be only used during setup and left off during regular operation.
Day Number/Time selection.
This setting will define the format for the charts x-axis.
Every row has a timestamp placed in column A. Column B (Day Number) is a calculated column
from the values in Column A. Using the Day Number makes the x-axis look less busy (and more
meaningful in some cases).
Number of Excel™ rows to Graph.
Maximum number of rows that will be graphed when “Auto Update
Graph” is checked (“strip chart mode”). This setting is not used for chart email requests.
Select Columns
This button will show a list of all of the columns in the Excel™
spreadsheet that can be used as source data for the graph. Each input is stored in its own
column. Additionally, there are ten “calculated columns” that can be continually updated
and can also be displayed in the graph. An example of a calculated column is “Day Number”
for which the starting date is subtracted from the current date during operation. Excel
graphs start to look too busy if more than five lines are shown, so try to limit the display
to three or four columns.
Output Specific Gravity
These toggles select if the BeerBotz app should write out the
specific gravity calculation for each meter. Selecting "yes" for a meter assumes that you have
saved the measured starting gravity and wort volume for this batch in the Excel blank
(see video: Software Start-up - SG Calc).
With the appropriate settings made in the first three tabs, we are now ready to press “Start” on
the Main page. Upon starting, the BeerBotz app will try to open up the selected Excel™ workbook.
If successful, the enabled input values will update on both the Main and Acquisition pages. Also
(if selected) the rows of new values will be saved into Excel™. The BeerBotz app requires exclusive
access to the Excel™ workbook. It is important not to impede the BeerBotz apps ability to save new
data to Excel™ while it is running. If it is desired to modify/reformat the workbook in any way
while the app is running, use the “Pause” button on the
Main Page. It is best, however, to start with a
properly-formatted spread sheet, and leave it alone during operation. While the app is
“Paused”, a new button appears on the Storage Page:
“Update graph”. This button can be used to modify which columns of data appear on the chart.
 Relay Page
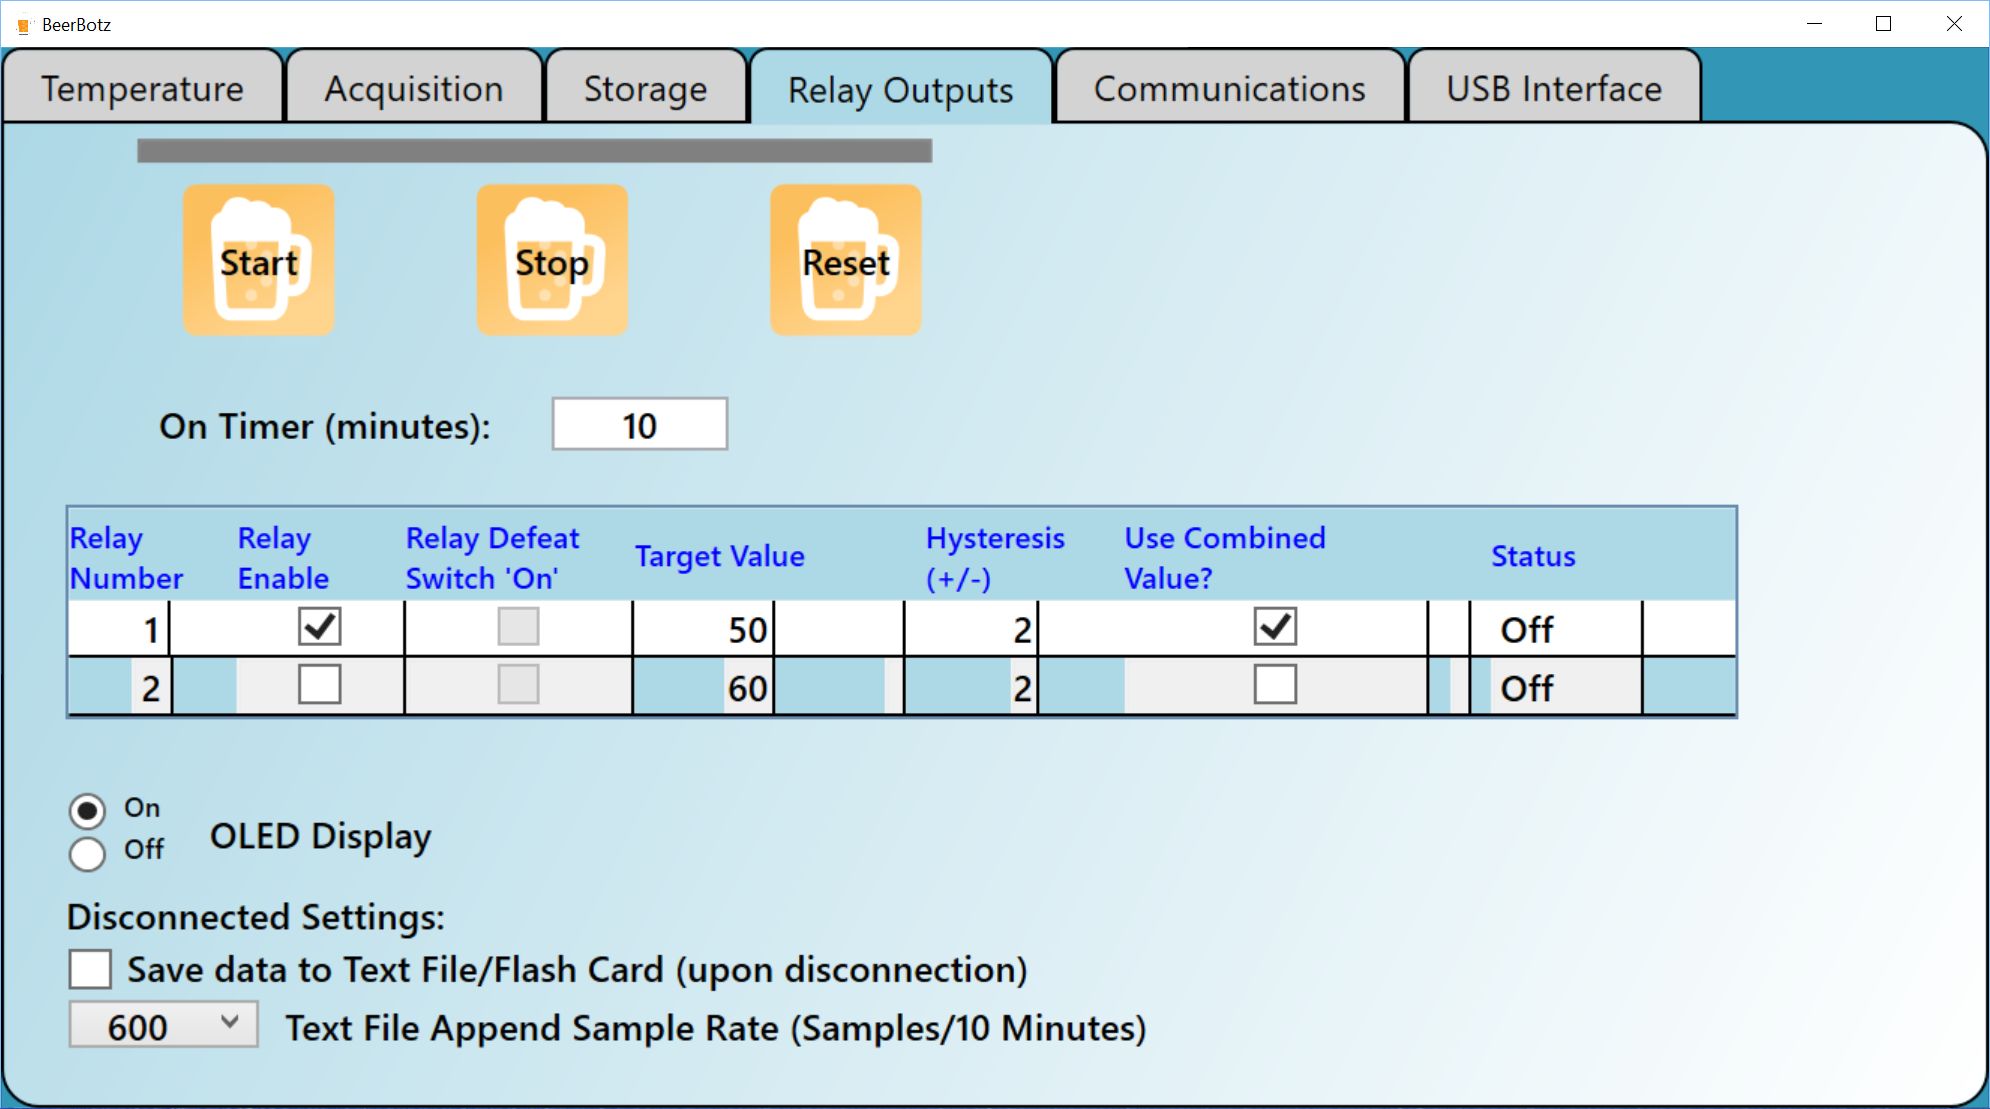
This page configures and controls the two relays for temperature cycling the cooling for the
fermentation. The relay operations are started and stopped separately from the input acquisition.
The Timer (minutes) selection defines how often the check is made that the temperature meets the
specified temperature criterion. This setting defines the minimum amount of time for which the
freezer motor will turn on again. It is not good to cycle the freezer motors on and off quickly.
Once a relay is fired, “Cooling” will appear in the Status column. The temperature criterion is
checked every second to try to turn the cooling off.
The remaining settings on the page do not pertain to the relay operations, and are defined as follows:
OLED Display.
Determines if the text display on the hardware device stays on
or not.
Save data to flash card.
The BeerBotz device is capable of stand-alone operation. Without
a PC connected, the BeerBotz device can: sample inputs, control the relays, and save the input
data to a flash card. This checkbox enables saving data to the card in autonomous mode (data-logger).
The data is saved as a .csv text file. This file can then be imported into Excel for
analysis at a later time.
Text File Append Sample Rate.
Determines how many rows are saved to the text file every ten minutes
(in Stand-alone mode). There is no averaging without the PC connected. Example: 600 rows/10 minutes
equals 60 rows/minute (or a row each second).
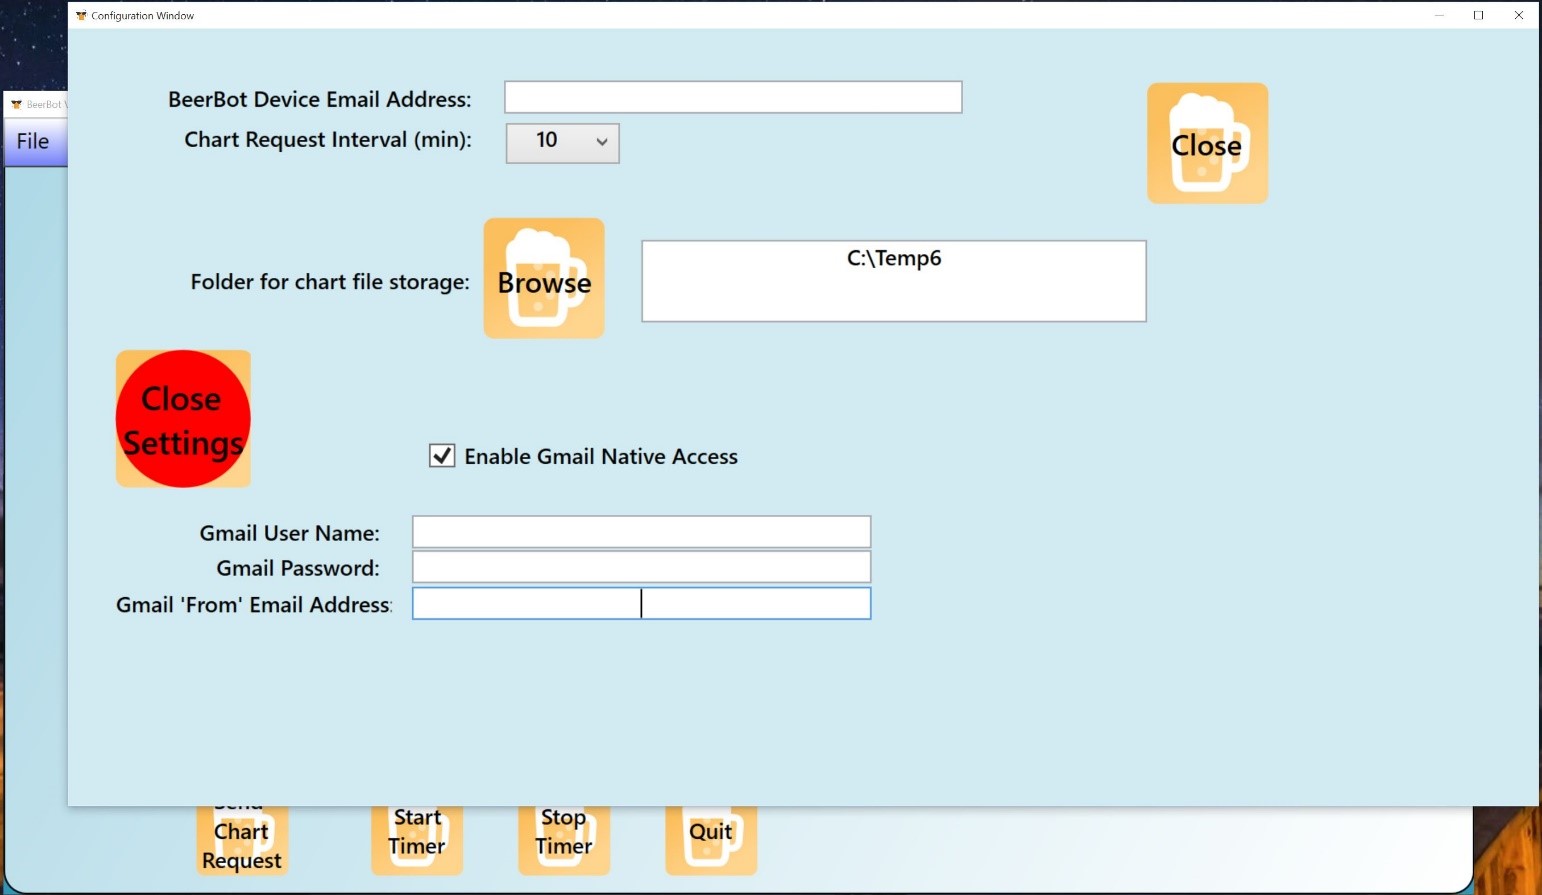
 Communications Page
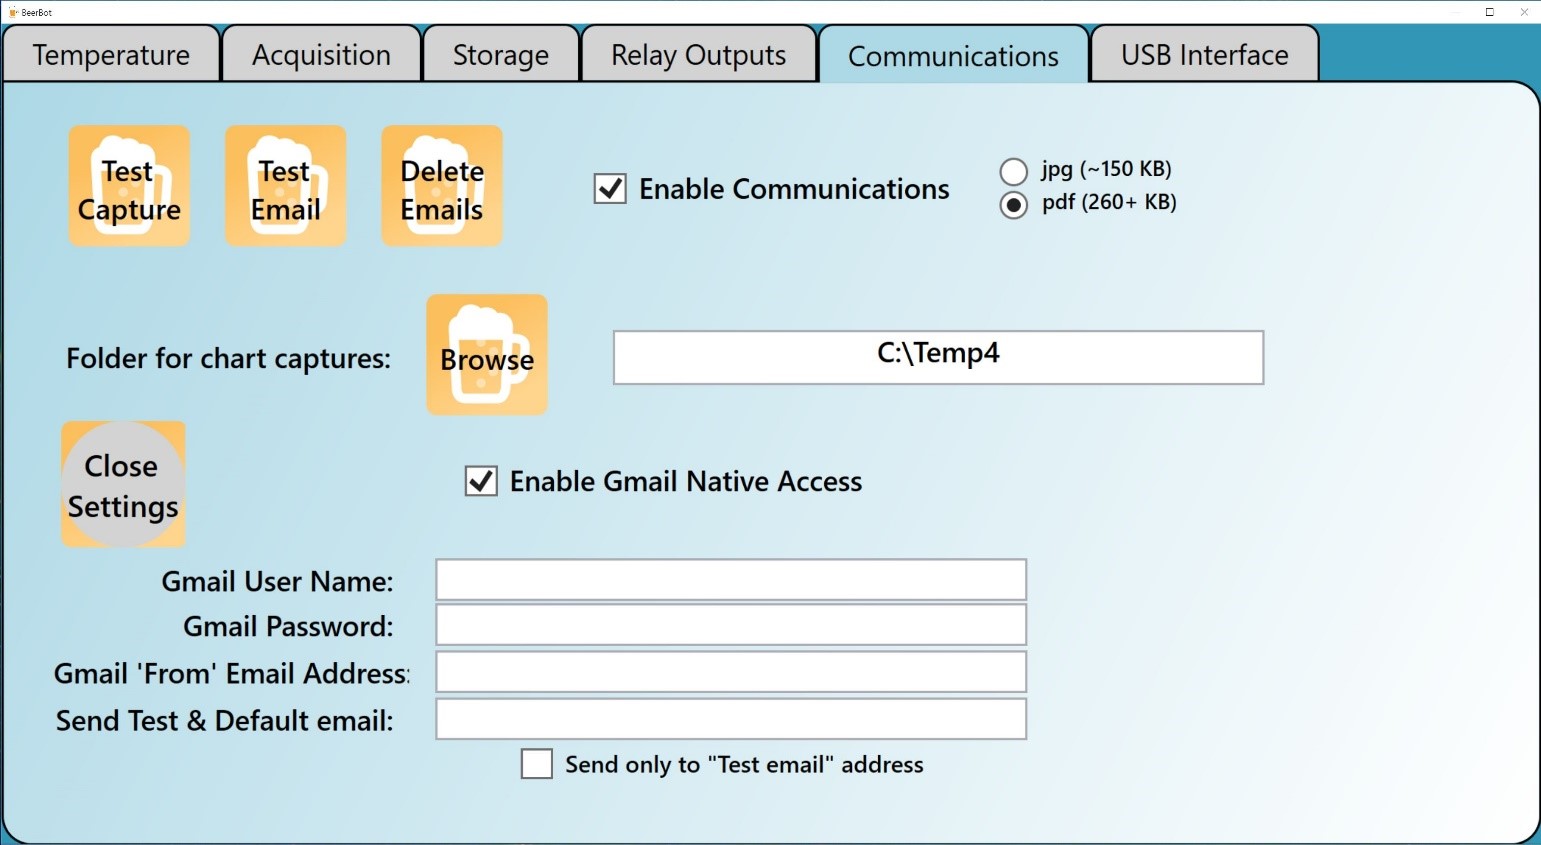
This tab configures the email chart request operations for the device. A Gmail email account is
assigned to the device. During operation, the email account is checked once a minute for any emails
that have a specific subject line (“Send Chart from BeerBot”). If this subject line is found, the full
Excel™ chart is prepared and sent to the return address found on the email. The quality of the chart to
be sent can be specified as either a jpg or pdf format. The jpg is always approximately
150 KB in size during operation. The pdf starts as a size of ~250 KB and gets larger as the number of
rows in the spreadsheet increases. The pdf format is best for display on an HDTV.
There are two separate login methods used to access the Gmail account assigned to the device: User
Name/Password, and “Gmail Native Access” (OAuth2). User Name/Password is the legacy/original email
authentication protocol (POP). Gmail Native Access uses a more modern security protocol. It forces the user
to login in to the Gmail account outside of the application. The end result is that Gmail Native
Access handles the emails faster, so this is the preferred method.
The final tab “USB Interface” shows the information that is
getting sent and received over the USB cable connected to the BeerBotz device. This can be useful
for troubleshooting. There is also access to a “Calibrate”
option on this page that enables a correction for each of the temperature probes after installation.
The Type-J thermocouples will have better accuracy if a correction value is measured and
applied after the installation at the specific site location. Also found on the calibrate page is
a correction variable that can be used to fine-tune the operation of the specific gravity calculations.
This wraps up the summary of the BeerBotz application. The device is now sampling inputs, storing the
data in Excel, and responding with a graph to anyone who sends it an email request. The next topic is
the BeerBotz Viewer, which automates the email requests to present the fermentation data on a remote
monitor/TV.
BeerBotz Viewer
 Viewer Main Page.
Viewer Configuration Page
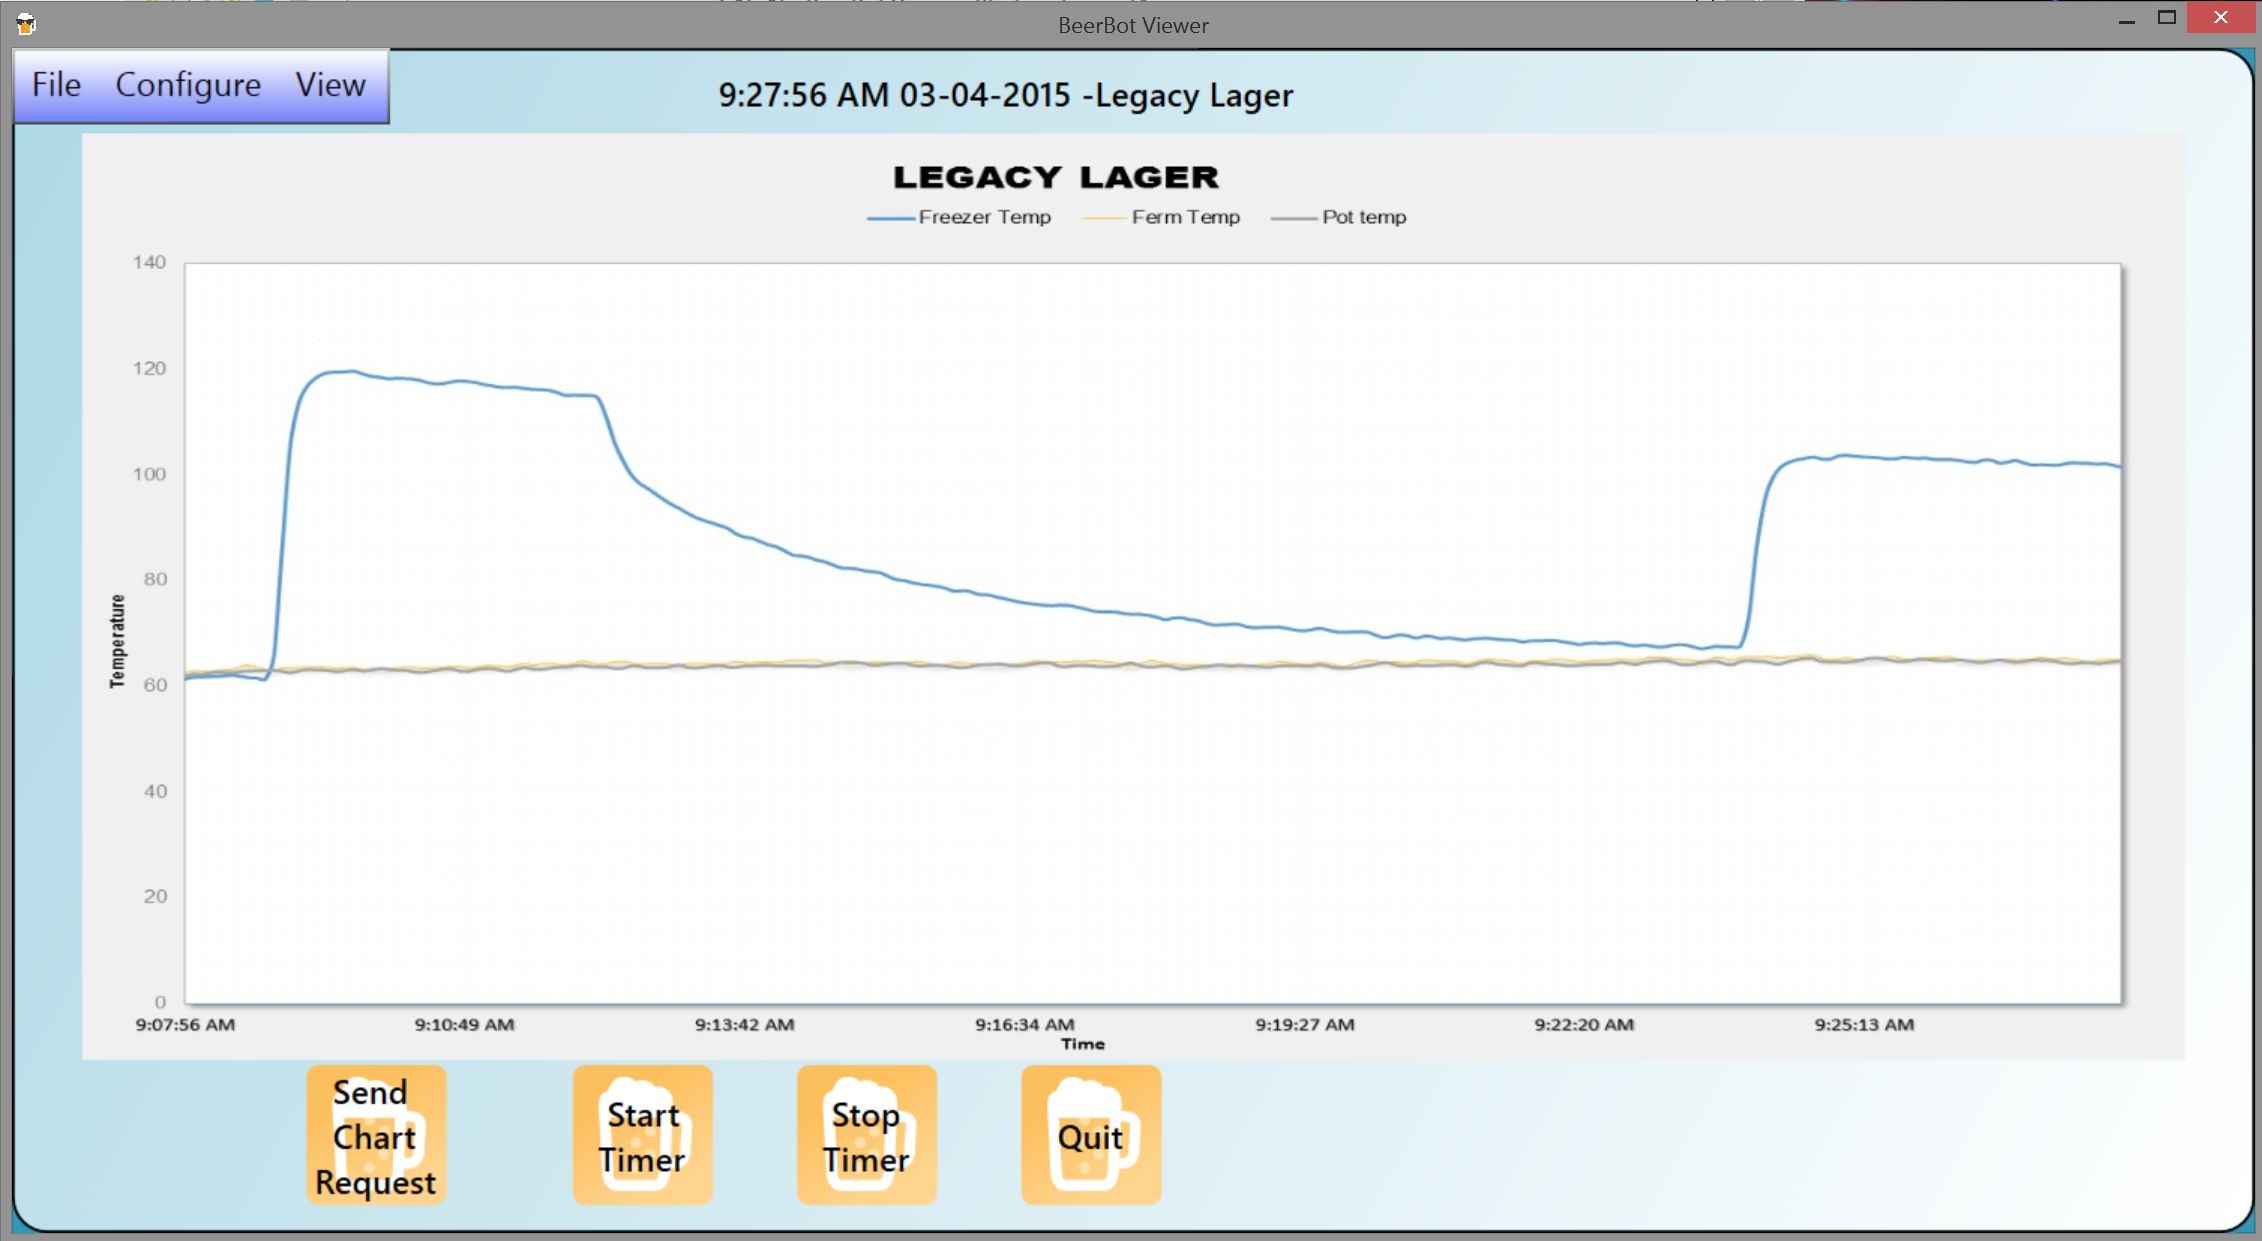
Viewer Main Page.
Viewer Configuration Page
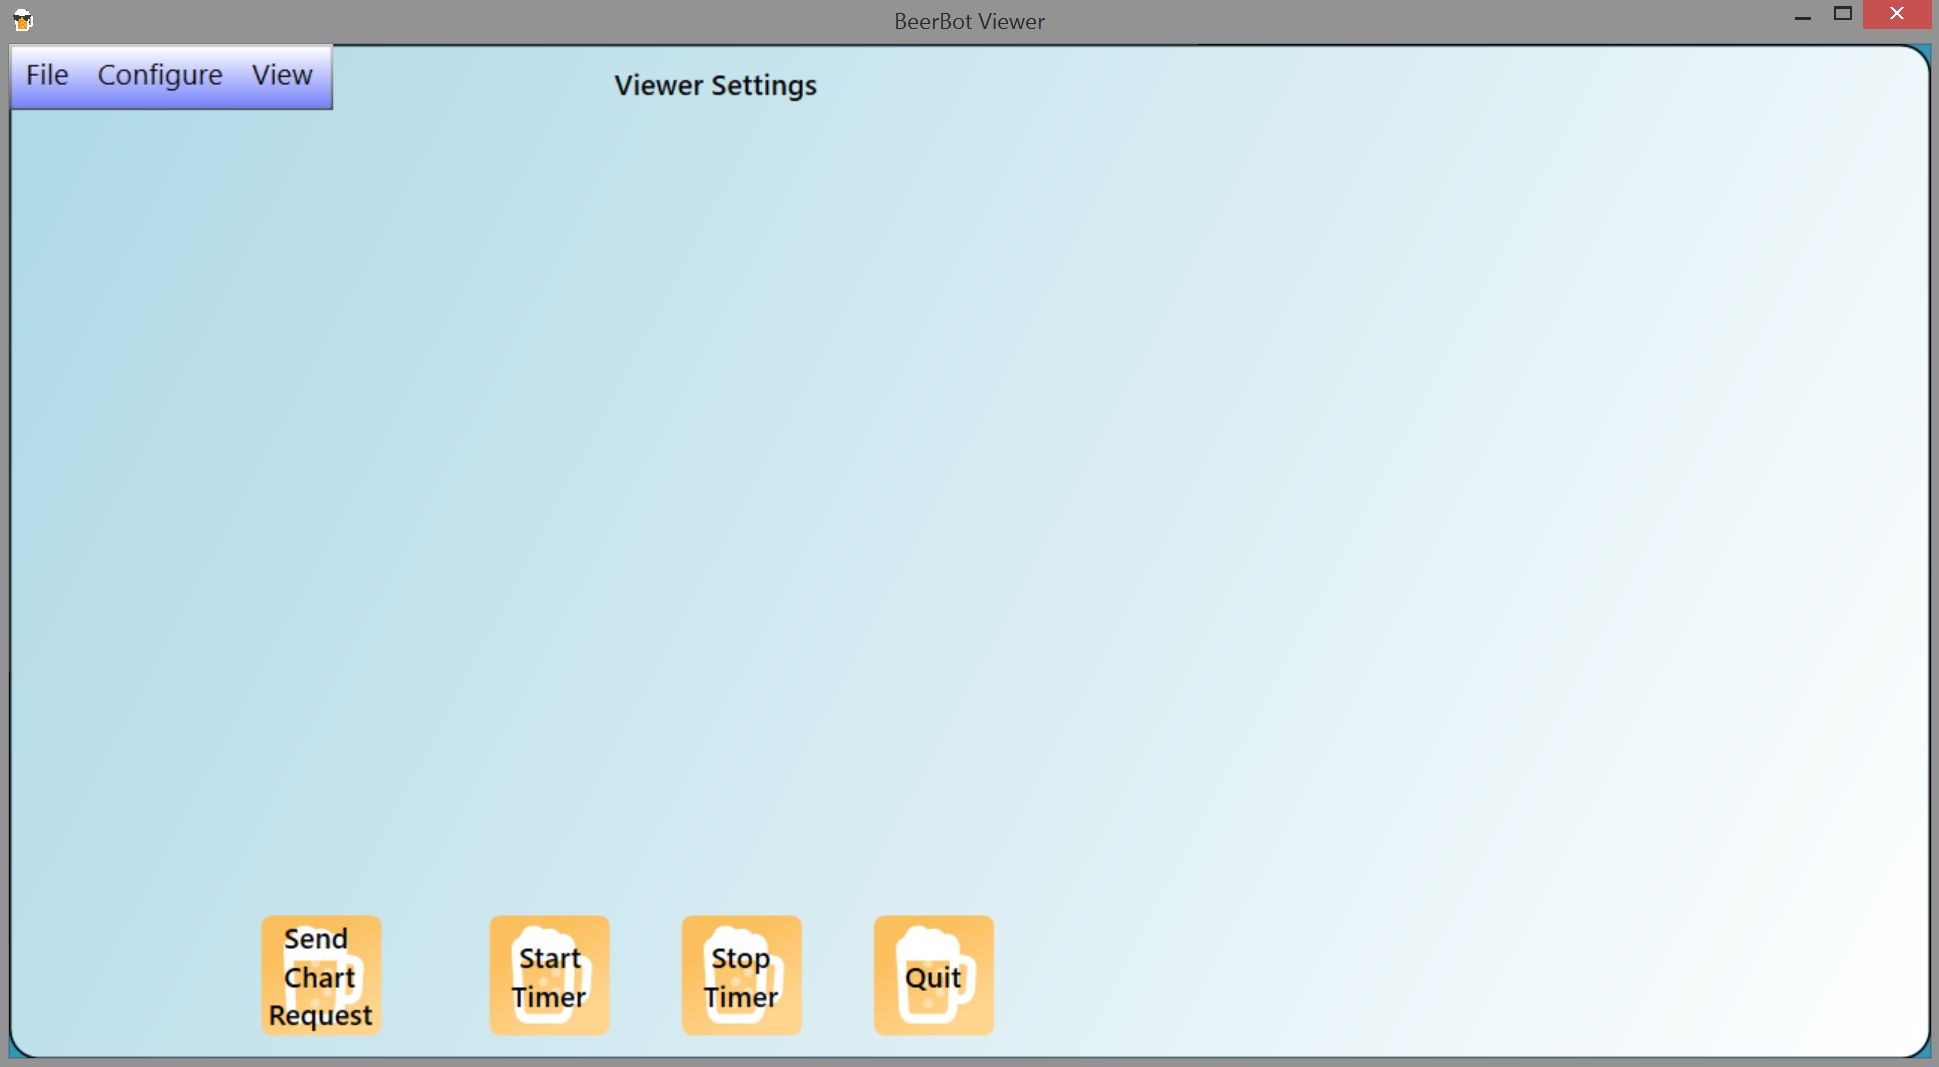
The Viewer opens up to Main Page with a similar layout as before. This viewer app is assigned its own
email address which it uses to send chart requests at timed intervals to the BeerBotz device. The
Viewer is first configured with its email address, the email address of the BeerBot device, and the
timing interval for the chart requests. The Viewer app also needs Adobe Reader installed on the PC to
display the .pdf chart format.
These settings are then tested with the
“Send Chart Request” button. This will send a chart
request and proceed to check every ten seconds for a response. The new graph is displayed as
soon as it arrives. A successful receipt of the new graph means that the Viewer email address
has sent the request, the BeerBot device received the request and prepared and sent the
graph, and the response graph was successfully downloaded from the Viewer email server. Once
we have received the response/graph, we know that all of the settings are fine, so at this
point we need to save the Settings file (File-->Save As) so we don’t have to type the email
addresses in again for this particular BeerBotz viewer and device. Now, the
“Start Timer” button can be activated, which will
send a chart request at the time intervals specified in the configuration page.
The graph can be resized to full screen using the “View” menu item.
 Viewer - Reply Received.
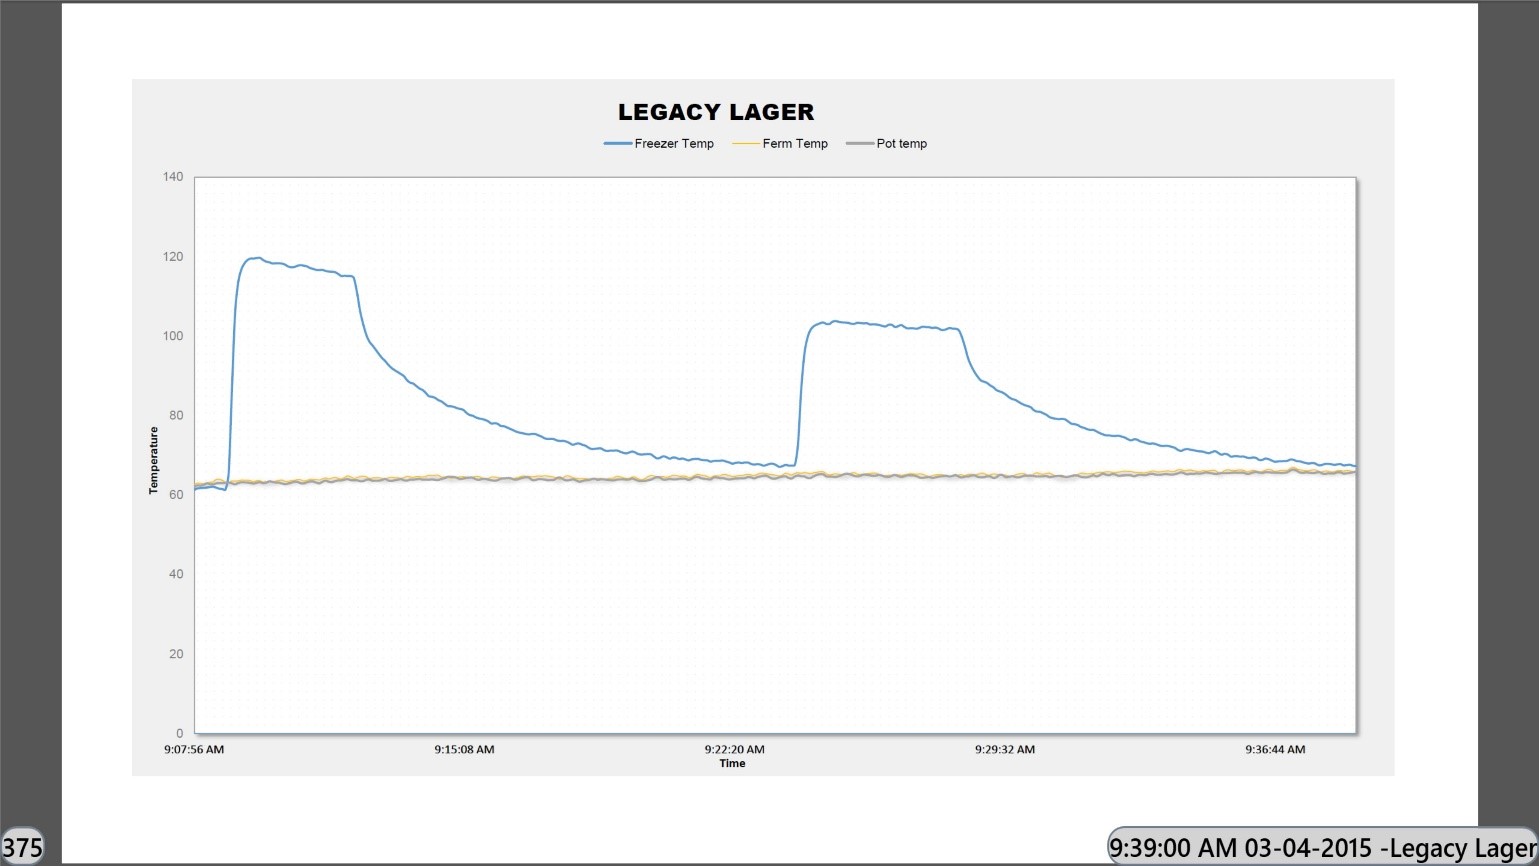
Viewer - Full Screen Display
Viewer - Reply Received.
Viewer - Full Screen Display
The image: Full Screen Display is presenting a BeerBotz graph received in .pdf format. There are
two gray text bars at the bottom of the screen. The one on the left (“375”) indicates the number
of rows that were adding to the target Excel worksheet since the previous graph was received. A
positive number means that rows are being added to Excel, which is what we want.
The text on the bottom right is time stamp of when this chart was created followed by the file
name of the Settings file on the BeerBotz device app. This time should be within the request time
interval + email processing time as related to the current time. So, if the request time interval
is 10 minutes, and it takes ~2 minutes to send and receive the new graph, this chart time stamp
should never be over 12 minutes older than the current time.
If the chart timestamp is recent, and the row numbers contains a positive value, you know that the BeerBotz
device/app is functioning properly. Double-click on the Time Stamp/File Name to exit Full Screen.
Any number of Viewer apps can be displaying the current fermentation data from the BeerBotz device.
Each Viewer app has to be assigned its own unique Gmail address. The graphs can be displayed as a
small window while doing other work on a PC, or as a full screen on a remote wall-mounted HDTV. A
stand-alone HDTV installation can be accomplished using a Windows™ TV stick.
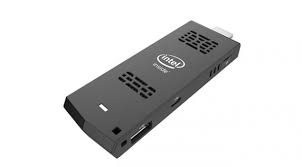 Intel Compute Stick™ -Windows 10 TV stick
These TV sticks have a quad-core Intel™ processor, built-in wireless networking, run
Windows 10™, and use an HDMI port on the TV for video output. For the BeerBotz Viewer to work
on these, one needs first to configure it to use the local wireless hotspot, and make sure the
Adobe Reader is installed. The original Intel™ Bay-Trail Compute Sticks are intended for 1080i
HDTVs, and do not work well with the older 720p HDTVs. The video driver doesn't allow the proper
scaling. The later versions of the Compute Stick may not have this problem.
We now have the fermentation data being collected and saved. The current data is remotely
accessible via email and the Viewer enables automated remote monitoring of the fermentation
progress. Lastly, let’s have a look at the BeerBotz Android™ Widget. This is essentially an
Android™ phone version of the BeerBotz Viewer.
BeerBotz Android™ Widget
The Android™ Widget enables the request and display of the latest graph with a single icon click.
The graph can also be manually requested with any email client program… the Widget just
simplifies the process.
The BeerBotz Android Widget apk is the installation file. This file can be emailed to the phone. When
the user tries to download this file on the phone, Android™ will ask if it should run the
installation. Once installed, the BeerBotz Widget is available as an option in the “available
Widgets” on the device. The Widget menu is brought up with a “long-press” on an empty part of
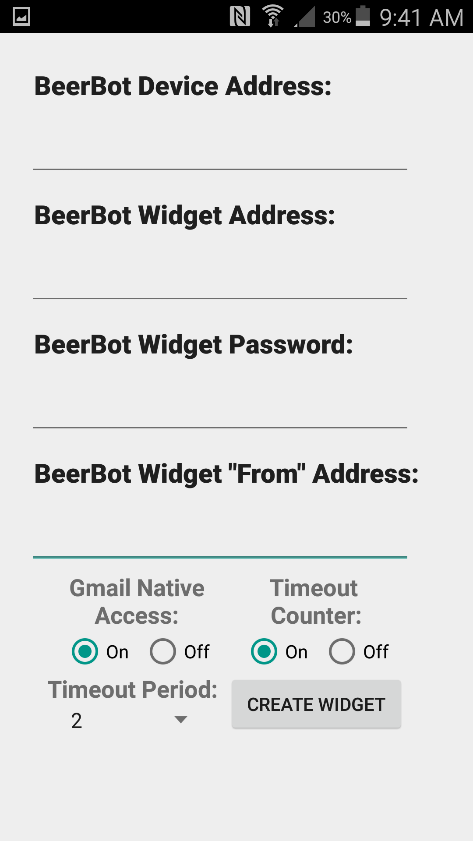
the screen. After an initial configuration when first selected in the Widget picker, a BeerBotz
icon is placed on the phone desktop. Upon clicking the icon, the Widget sends a chart request
to the BeerBotz device. It then checks its email inbox every 10 seconds. If the new graph is
received, it is then displayed with the default viewer app that is set up on the phone. There
is a user-configurable timeout period setting for this email checking. If the new chart is not
received within this period, the BeerBotz icon will display that the timeout period had been
reached to signal that the chart request was unsuccessful.
The following are some pictures of the BeerBotz Widget in action to give you a feel for how it works.
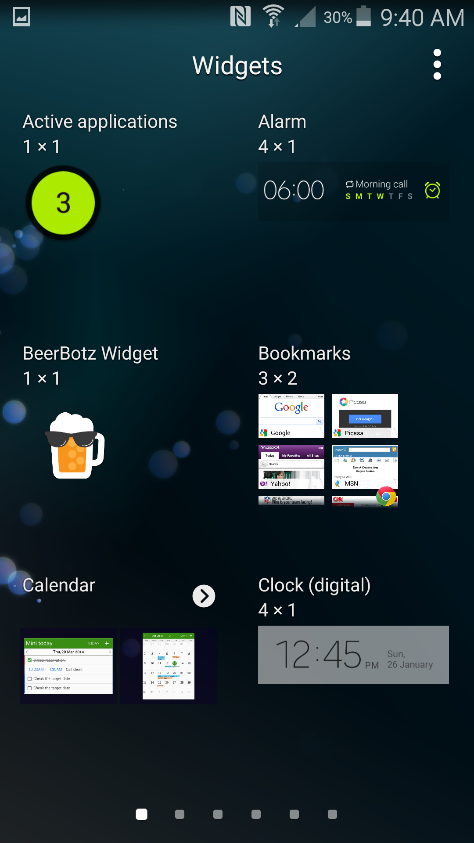
 Select BeerBotz Widget.
Configuration
Widget on Desktop
Select BeerBotz Widget.
Configuration
Widget on Desktop
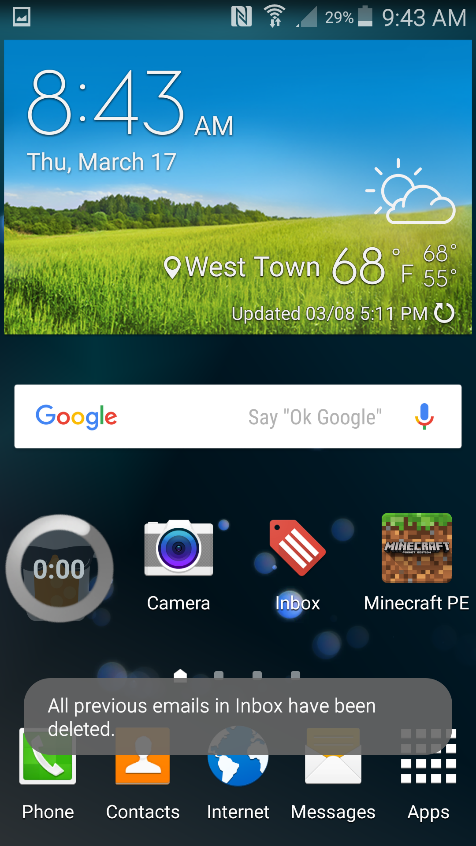
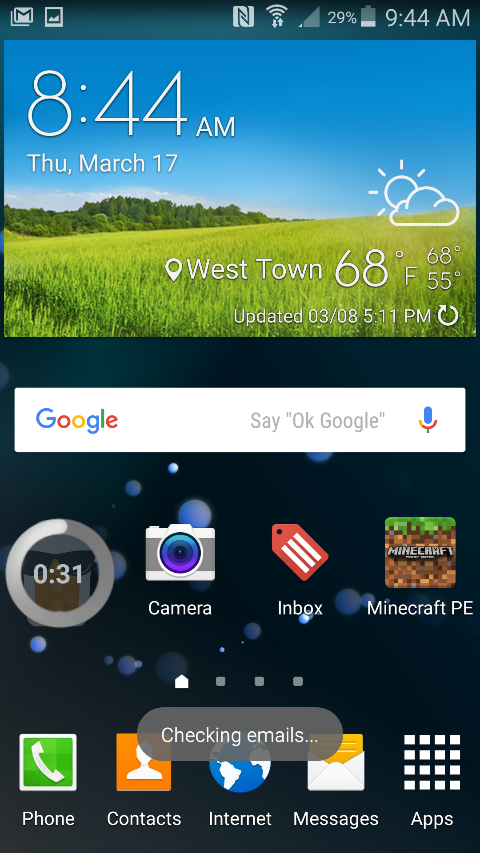
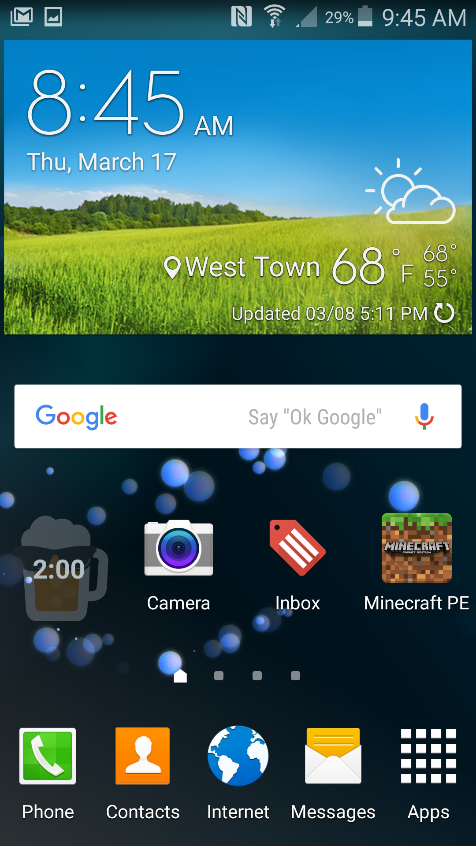 Push to Start.
Checking emails...
Request unsuccessful!
Push to Start.
Checking emails...
Request unsuccessful!
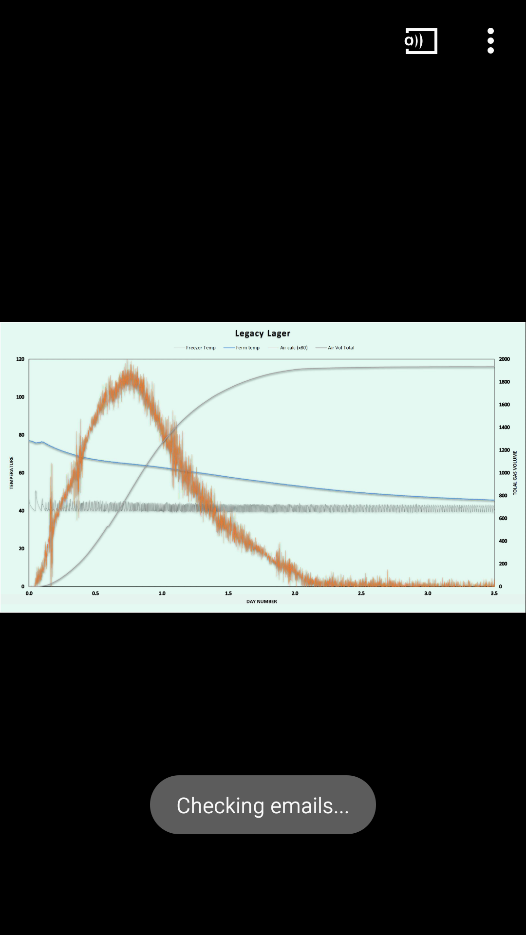
 Request successful!
Rotate phone for full screen view
Request successful!
Rotate phone for full screen view