
Batch Score - Instructions
Quality Assurance In The Brewery
QA is a two step process involving:
- taking measurements of batch performance parameters
- Displaying/using them in such a way that they are compared to previous batches
There is no reason to keep records unless they are used in a sensible way for quality control.
The BeerBotz system allows you to measure the performance during a batch. The Batch Score
allows you to easily compare this batch performance to previous batches.
Normal brewery operations involves taking yeast count and viability measurements for a batch.
This provides a confirmation of yeast pitch rate (quantity), and number of healthy yeast
present (quality). It is important to monitor the yeast quality since it is being reused
across multiple batches.
The BeerBotz system provides a gas reading directly in mass of CO2. This gas evolution rate
corresponds to the sugar consumption rate. This is also a measure of yeast quantity &
quality. The greater number of healthy yeast added... the faster the batch gets to the peak
rate and the greater the actual number value of the peak flow. A small yeast pitch rate
will take longer to get to max flow (as the yeast generate more numbers). Once the max flow
is reached, since it would have taken longer to get there, the actual peak flow number
value will be less. This is because there were more sugars consumed at a steady rate up
until the max flow rate.
With the BeerBotz system we measure the actual performance of the batch sugar conversion rates.
With the yeast monitoring, we are just trying to insure that we have a good amount of healthy
yeast in there to perform the sugar conversion.
Neat heh?
Next, let's go through how to get a batch score.
Example Graphs From Batch Data
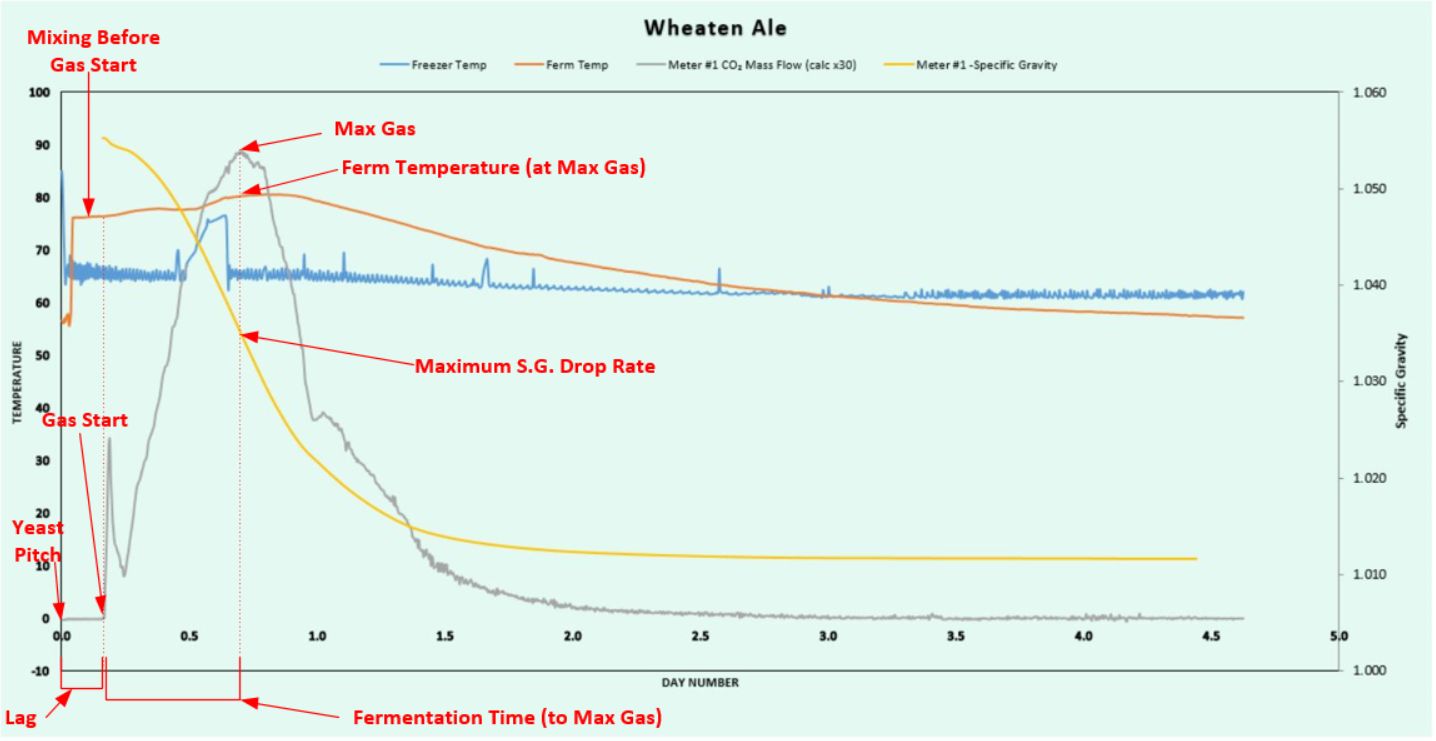 Ale Graph Example
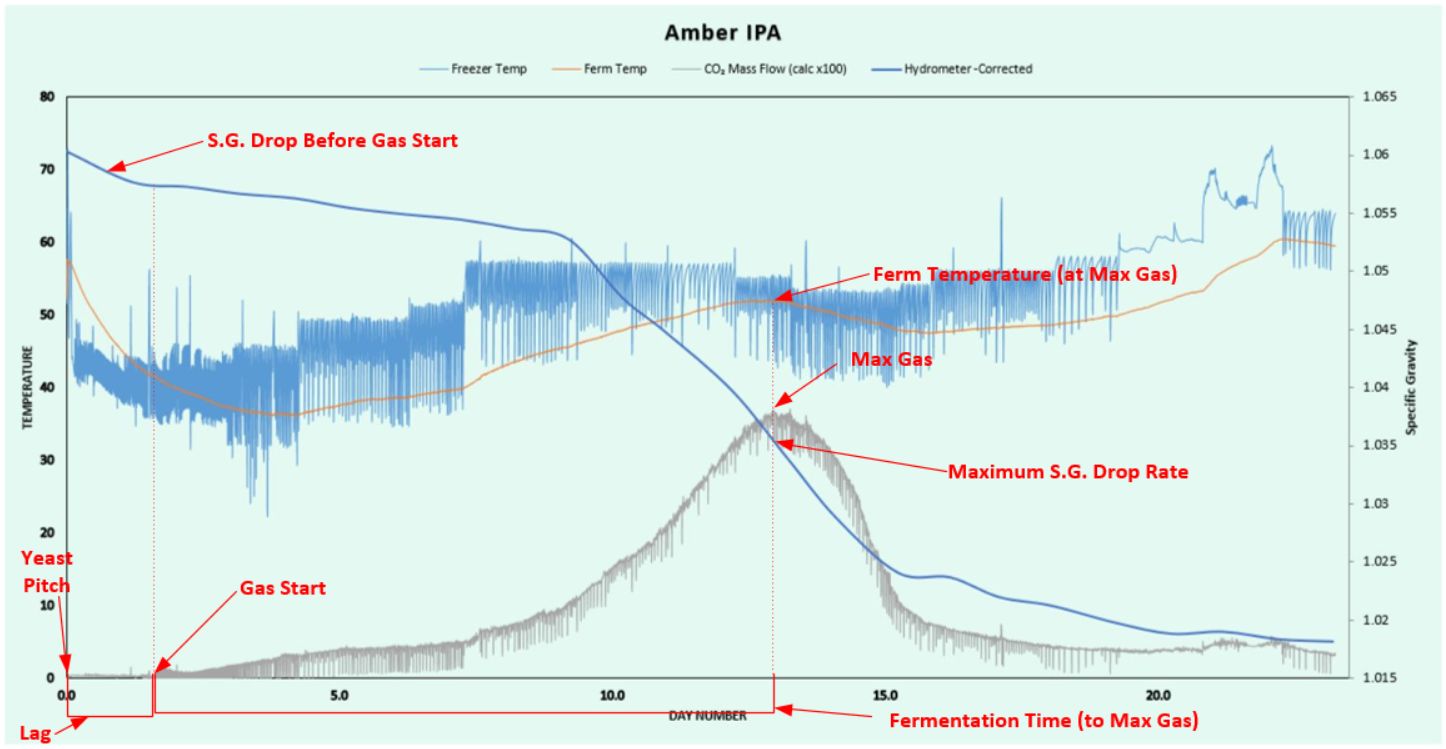
Looking at the Ale Graph, you can see the the CO2 evolution rate gives an indication
of the sugar consumption rate (aka specific gravity reading). The point at which the gas hits
the peak rate is also the point at which the S.G. drops the quickest.
The gas rate is influenced by pitch rate/quality. During this ale fermentation the yeast was pitched
at the begining/left of the graph. Notice that the internal wort temperature (orange line) was stratified
with regard to temperature. The temperature probe on this fermenter is mounted low in the vessel. When the
batch was first started the reading was ~55℉. But the temperature at the top was a lot higher.
What was needed was some mixing of the fermenter contents. This mixing happened before any gas
started coming out. If you were to measure, you would also see that the S.G. would drop a little
before any gas is observed. This is because the wort has a capacity to hold on to/disolve a
certain amount of CO2 depending on the wort temperature. This disolved capacity must
be exceeded before we will see the gas bubbles.
All fermentations have a Gas Start time and a Max Gas peak. An ale graph shows these two values clearly.
To find out the timing/day number, just hover your mouse over the points of interest on the graph
and there is a popup that gives you the data point value. You can then find the row that contains this
data point in the raw data.
Another way to get to the data row of interest is to run a command in Excel™ to determine the row number.
This takes a little more work. With an ale graph, these points are obvious from the graph and you can
get right to them. With a lager fermentation, you will have to put a little more effort into
determining the Gas Start location. The important thing is to record the points in a consistent way, so
that the different batches can be compared. In all cases, the Max Gas number can be easily be
obtained by searching for the Maximum in the meters' raw data (Column H for Meter #1).
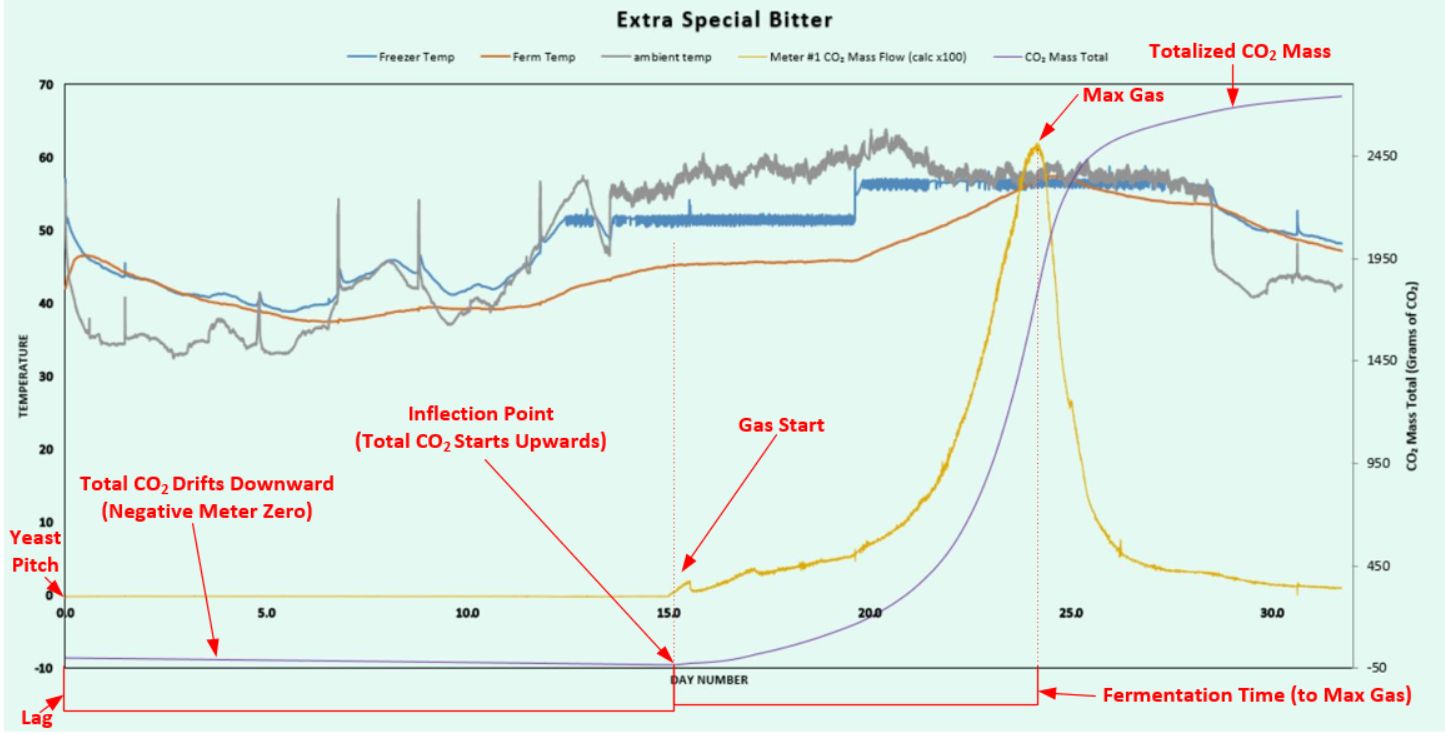 Lager Example - Negative Meter Zero
Lagers are a challenge because they start and ferment slow. It can take a while to get noticiable gas evolution.
In this example, it is even worse because the yeast were cold-shocked. The temperature in the outdoor shed got very
cold (during a Chicago winter) and also an ale yeast was pitched (which does not perform well at low
temperatures). Once the wort temperature was warmed to >45℉ the fermentation proceeded as normal. (This
was after two weeks though!)
During this long period of no action the meter is reporting some zero value (either positive or negative).
Try as you might you can never adjust the meter to read exactly zero. If it reads to three decimal
places of zero, then that is the best you can do (eg. 0.0006). You need to find the spot where the meter zero
reading starts to change into real gas readings. One way this becomes obvious is to display the CO2
Mass Total on the 2nd y axis.
In this example the CO2 Mass Total is displayed as the purple line. You see that during the first 15 days
of inactivity, the value drifts slightly downwards. This is because the meter zero was a negative number.
This makes it pretty easy to get the Gas Start day number. All you have to do is search for the Minimum value
in the mass total column. That's the row that gives you your Gas Start day number. Easy!
 Lager Example - Positive Meter Zero
Getting the Gas Start value for the first two examples (ale and lager with negative meter zero) was easy. The
third and last example (lager with positive meter zero) is the hardest. This is because the mass total is incrementing
(not decrementing) during the period of no action. The trouble then is to "pick" where the bubbles actually
starting coming out.
One dependable way to accomplish this is to use the the CO2 Mass Total again. The meter zero is
positive in this case but it is still a number very close to zero. As such, the zero values do not contribute
much to the mass totals. The meter zeros' contribution will be a small fraction of the ending mass total.
You can set a small fraction of the mass total to ignore at the begining (say 0.25%). Once
you find that value in the mass total column you use that row for the Gas Start.
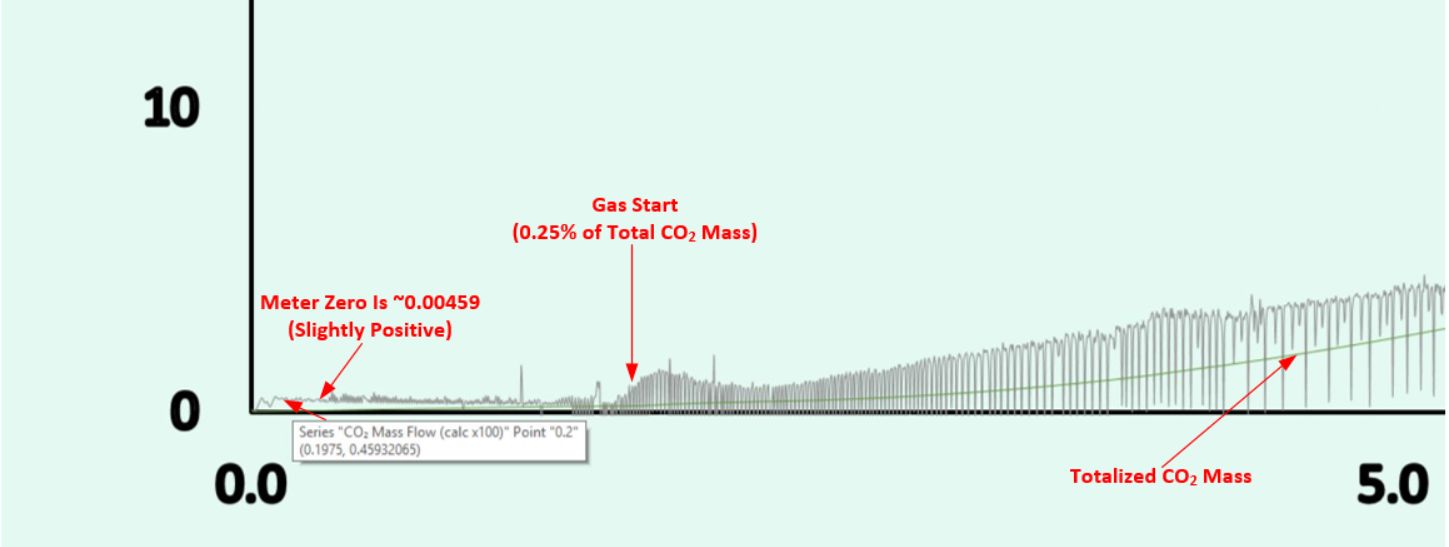 Positive Meter Zero - with Mas Total Line
Let's look at a zoomed-in section of this example (bottom left corner). In this shot, the green line is the
CO2 Mass Total. You see that the meter zero (no bubbles) is reading at 0.00459. During the period
of no action this will increment the mass total slightly. One has to determine what 0.25% of the ending mass
total is. That would be the final row reading in the mass total column (column Q in the example spreadsheet)
multiplied by 0.0025.
The final entry for the mass total in the example spread sheet is 3082 gm CO2. 3082 x 0.0025 = 7.70.
Next, you look for the values in the mass total column that are lower and higher than 7.70. Once found, use
the lower row as your Gas Start row. This puts the Gas Start location at a point where you can visually confirm
that it makes sense.
That last example was not too easy, but you will find that it is not a big deal after you go through it a couple
of times. Once you have the two time values/rows #'s (day numbers for Gas Start & Max Gas) you will have to
populate the Batch Score spreadsheet with the following information:
- gas start time (day number)
- max gas (day number)
- rate measurement value at max CO2 (from column H for meter #1)
- temperature at max gas (from column D in the example sheet)
One last important observation is that, for the different batches to be compared to each other, you have to use the
same data capture settings for all of them. I just stay with the 60 samples per minute / 300 samples combined
resulting in 5 minute rows. The problem with different settings on the batches is the smoothing of the
Max Gas rate variability. At 1 minute rows (averaging 60 samples), you will get a higher peak rate then an
average of 300 samples will give. The averaging of the 300 values smooths out the variability more then the 60
value average does.
That's all you need to start recording your batches into the Batch Score sheet. For each additional batch/row
you add you will need to update the main graph to include that new row. You can also choose to have different
graphs/tabs or just have one graph and turn the individual lines on or off to view the different results.
For further instruction, there are two videos (Batch Score Introduction
and Instructions) that demonstrates this process in
action. There is also an Excel™ cheat sheet that
lists the commands needed to display the row locations to obtain the Gas Start and Max Gas row numbers.