Remotely Access Fermentation Status !
The values from the temperature and gas inputs on the BeerBotz device are tranfered to the PC. The PC
utilizes the power of Microsoft Excel™ to average and display the values via the BeerBotz
application. In addition to saving this data, the BeerBotz application makes graphs based on it
available to a remote user. The following explains some example data and the three methods this
information it is made available to a remote user:
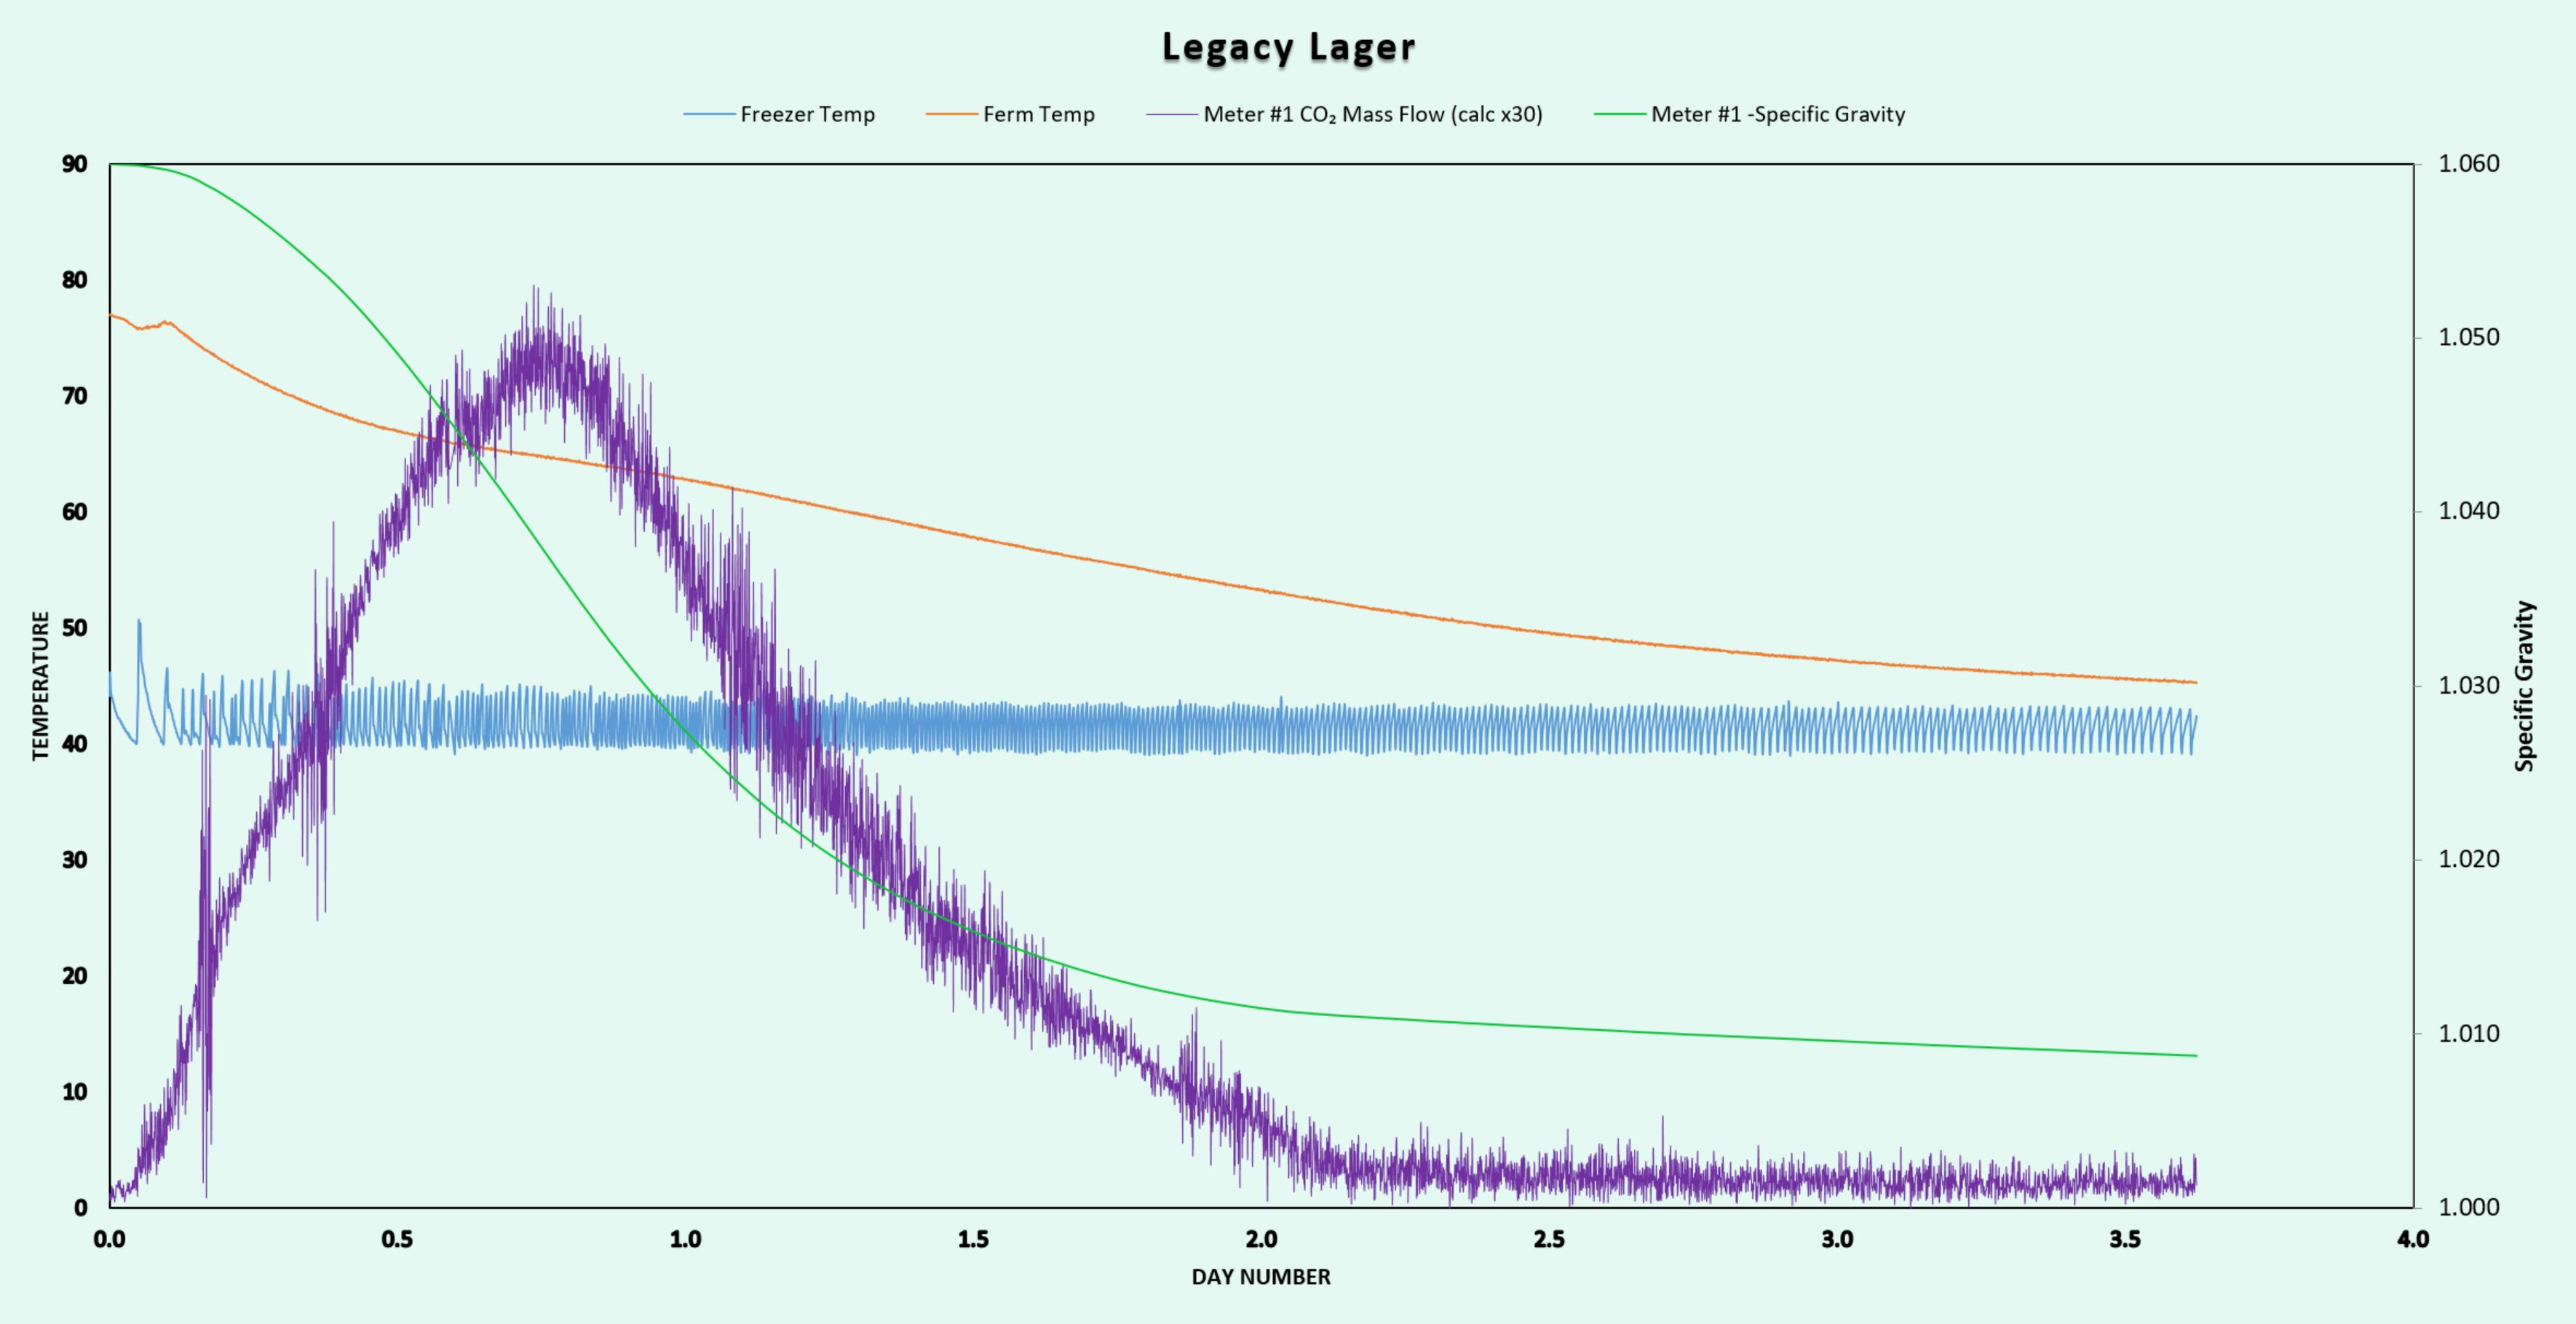
The data gets added to the spreadsheet as the fermentation progresses. In the graph to the left, the
CO2 (purple line) starts at zero when the yeast is first pitched. As the fermentation proceeds,
the CO2 rate increases, then subsides when all of the malt sugars have been consumed. The
S-shaped line is the totalized value of the CO2 rate. It starts at nothing, and ends at a
value that is related to the starting amount of malt sugars (and the ethanol that was created).
This relationship can be utilized to create calculated columns in the speadsheet and, in turn, custom graphs
that are automatically updated each time new data is added to the spreadsheet.
The BeerBotz system uses email as a mechanism to deliver the current chart/graph information to
the user. A unique email address is assigned to the device (Gmail™ email accounts only).
During operation the device checks its email inbox once every minute. To request a new chart, the
remote user sends an email (with specific text in the "Subject" line) to the device. The device/PC app,
will respond back with the current chart as an attachment.
Chart Request Methods
There are three methods of requesting chart updates from the BeerBotz device during operation:
- Manually via email
- Using the Android™ Widget/App
- Using the PC Viewer application to automate the requests
Manually via email
As previously mentioned, an updated chart can be requested from the BeerBotz device/App during operation
by simply sending it an email (non-Gmail™ email accounts are ok here) that contains a specific
line of text in the "Subject" line. The BeerBotz device checks its email once a minute. So the total time it will
take to get the response is the sum of:
- The time to deliver the chart request from the requestor to the device +
- The time the BeerBotz device/app takes to process the request (~1 minute) +
- The time it takes to deliver the chart to the requestor.
The delivery time from the device to the requestor is sometimes a function of how large the chart is
(depending on the speed of the network connection). There is an option in the PC app to use either
.jpg or .pdf as a file format. The .jpg is the choice when you want to keep the file size small.
These files are always ~150 KB in size no matter how many rows are being graphed. The .pdf is the
choice for high quality. These files start at a size of ~260KB and get larger as more rows are
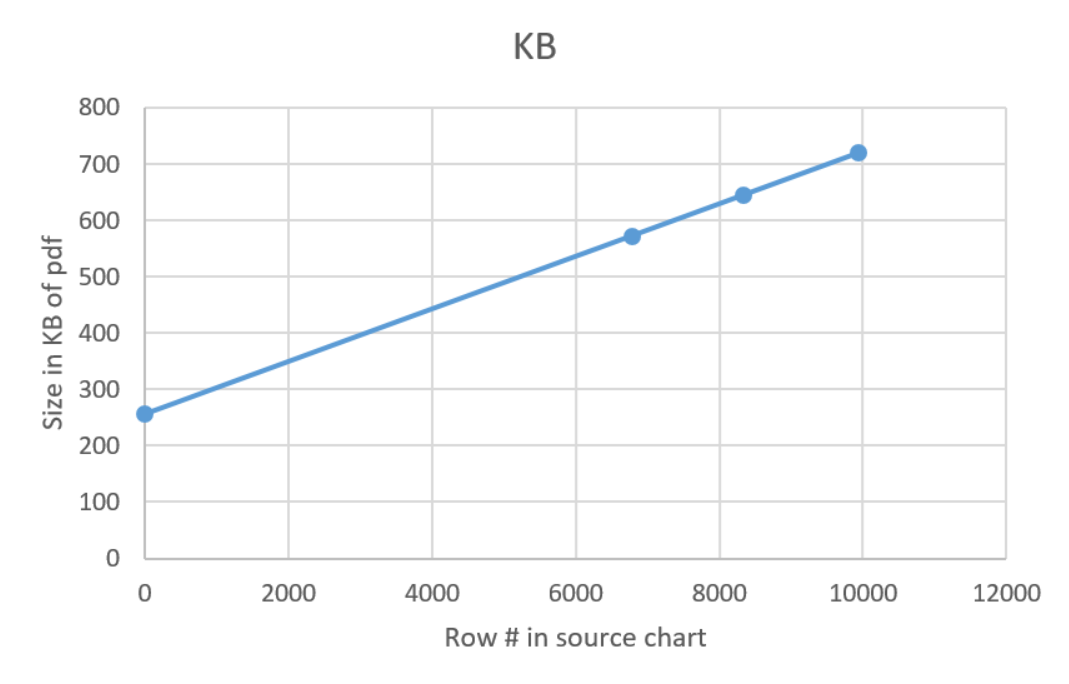
added to the data for the chart. The chart to the right is an observed relationship between the .pdf
file size on the underlying row number totals. This could of course vary depending on how many columns
are being graphed. From this data the .pdf file size starts at ~250K and (not shown on this chart)
at 16K Excel graphed rows the file is ~1 meg. So you can see that you need to keep in mind the number
of rows you are generating in Excel, and what your network data charges are if you intend to move large
files frequently.
Using the Android Widget/App
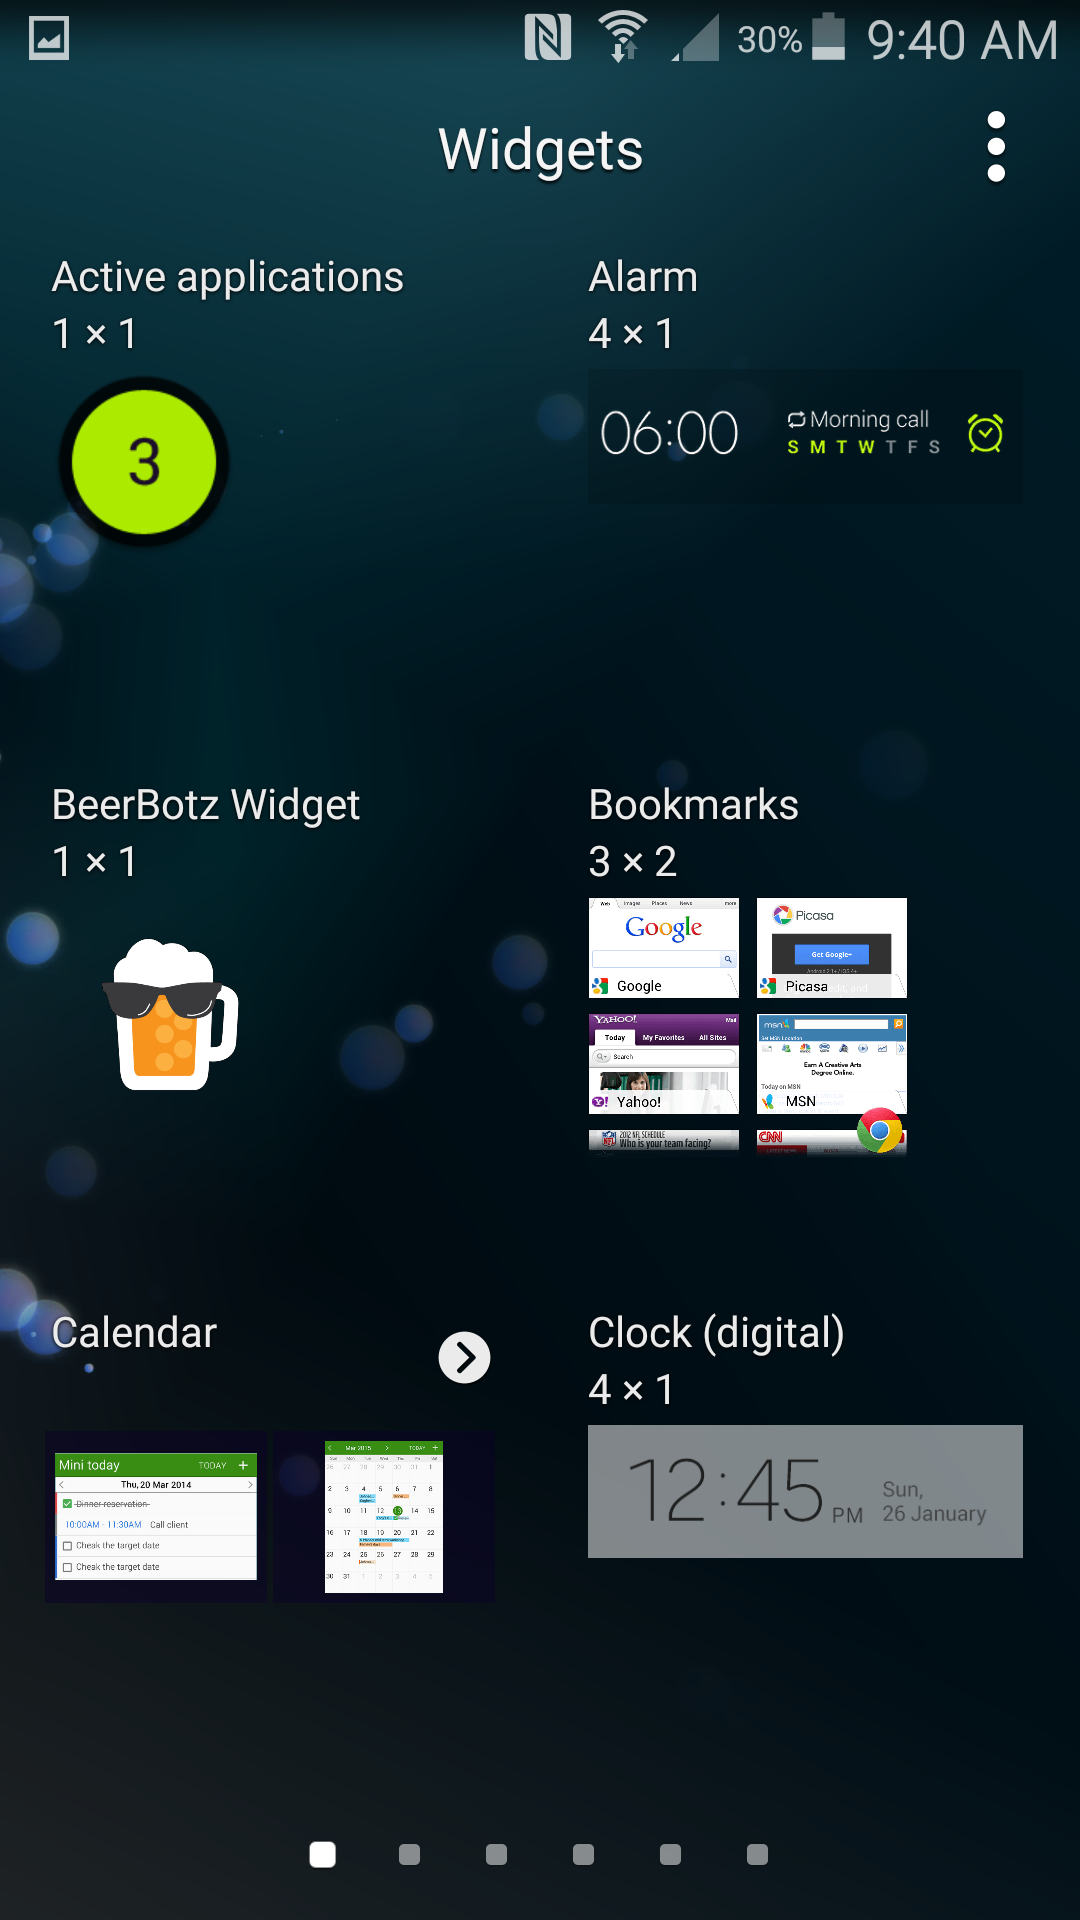
The Android™ Widget automates the process of manually sending a chart request email. First,
the installer (apk file) is run on the Android™ phone. The Widget will then be available
in the Widget picker (see picture). The BeerBotz Widget is then selected (held down) and dragged to
an empty spot on the phone desktop. This causes the configuration page for the Widget to pop up. In
here we are entering the BeerBotz device Gmail address and a seperate address just for this Widget
(Gmail™ email accounts only). As part of its operations, the Widget deletes all of the
messages from this Gmail™ accounts' "Inbox", so never use your personal email account
for the Widget! After this configuration page, the Viewer icon is available on your phones' desktop.
One tap of the icon will initiate the chart request. When the new chart is received, it will
automatically display using the default app for that file type. For .pdf's the latest Adobe
Acrobat Reader™ has been preventing a full screen view, so I have tried other options. For
.jpg's the default app is usually the Gallery. The default viewers are defined in the Android™
system, and can be changed at any time.
Using the PC Viewer application to automate the requests
The BeerBotz Viewer provides a way to automate the chart requests to occur at a user-defined time
interval. It is designed to turn a Windows tablet or a wall-mounted HDTV into an remote chart viewer.
It can be run in a window, or as a full screen app.
It is configured similarly to the Android Widget with the additional detail of the time interval
for the chart requests (Gmail™ email accounts only). After a chart request is sent
(say once every ten minutes) the Viewer checks its email for the reply at ten second intervals.
If it gets the reply, it will display the chart, and not send another request again until the
ten minute send-request-timer elapses. If it doesn't get the reply by the time the
send-request-timer elapses, that means that there is no network connection to the BeerBotz device.
In this case, a backoff timer is set up and another send-request will not go out for a half-hour.
If it does receive a reply as normal next time, the normal operational timing will resume.
To look good on an HDTV monitor, the .pdf file type is preferred. Since this file type can grow to
a large size, it would only make sense to use the Viewer in the same building (on the same network) as BeerBotz
system so there is no charge for the data usage over the network.